

Pola sebenarnya

Bullish Rectangle
was formed on 14.04 at 13:01:10 (UTC+0)
signal strength 1 of 5
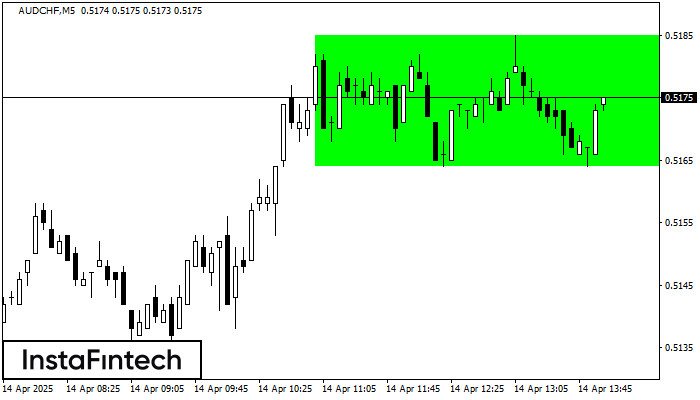
According to the chart of M5, AUDCHF formed the Bullish Rectangle. The pattern indicates a trend continuation. The upper border is 0.5185, the lower border is 0.5164. The signal means that a long position should be opened above the upper border 0.5185 of the Bullish Rectangle.
The M5 and M15 time frames may have more false entry points.
- All
- All
- Bearish Rectangle
- Bearish Symmetrical Triangle
- Bearish Symmetrical Triangle
- Bullish Rectangle
- Double Top
- Double Top
- Triple Bottom
- Triple Bottom
- Triple Top
- Triple Top
- All
- All
- Buy
- Sale
- All
- 1
- 2
- 3
- 4
- 5
Bearish Rectangle
сформирован 09.05 в 04:05:35 (UTC+0)
сила сигнала 2 из 5
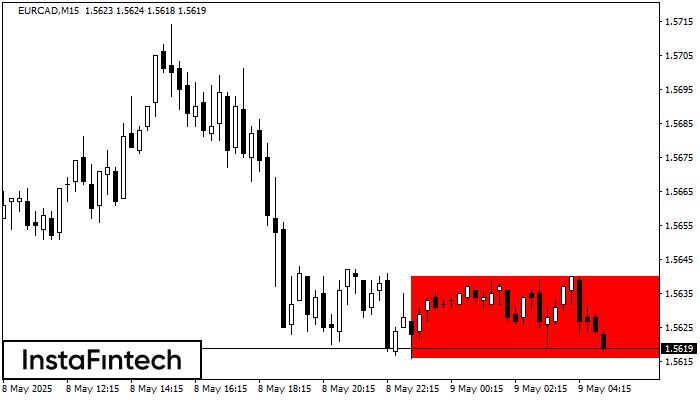
According to the chart of M15, EURCAD formed the Bearish Rectangle. The pattern indicates a trend continuation. The upper border is 1.5640, the lower border is 1.5616. The signal means
The M5 and M15 time frames may have more false entry points.
Открыть график инструмента в новом окне
Bearish Rectangle
сформирован 09.05 в 04:05:14 (UTC+0)
сила сигнала 3 из 5
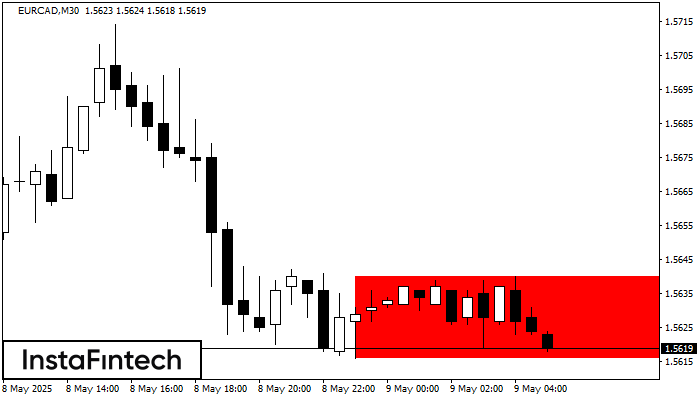
According to the chart of M30, EURCAD formed the Bearish Rectangle which is a pattern of a trend continuation. The pattern is contained within the following borders: lower border 1.5616
Открыть график инструмента в новом окне
Double Top
сформирован 09.05 в 03:59:58 (UTC+0)
сила сигнала 1 из 5
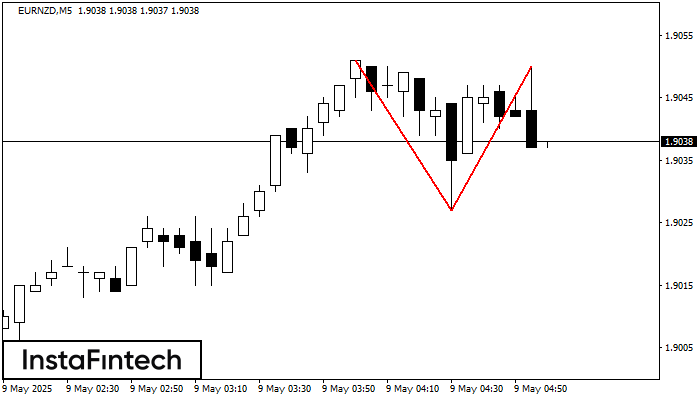
The Double Top reversal pattern has been formed on EURNZD M5. Characteristics: the upper boundary 1.9051; the lower boundary 1.9027; the width of the pattern is 23 points. Sell trades
The M5 and M15 time frames may have more false entry points.
Открыть график инструмента в новом окне


