

Pola sebenarnya

Bullish Rectangle
was formed on 14.04 at 08:47:26 (UTC+0)
signal strength 1 of 5
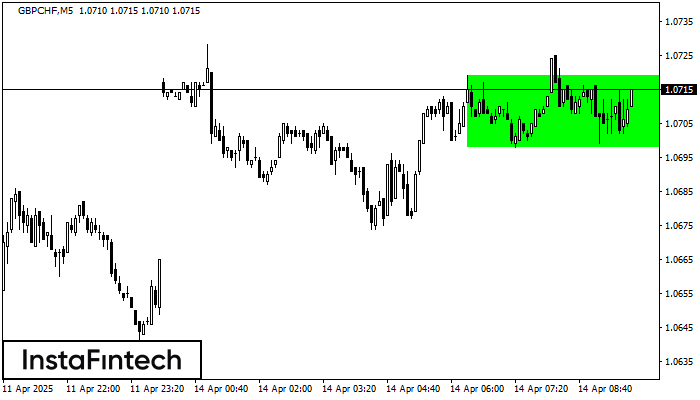
According to the chart of M5, GBPCHF formed the Bullish Rectangle which is a pattern of a trend continuation. The pattern is contained within the following borders: the lower border 1.0698 – 1.0698 and upper border 1.0719 – 1.0719. In case the upper border is broken, the instrument is likely to follow the upward trend.
The M5 and M15 time frames may have more false entry points.
Lihat juga
- All
- All
- Bearish Rectangle
- Bearish Symmetrical Triangle
- Bearish Symmetrical Triangle
- Bullish Rectangle
- Double Top
- Double Top
- Triple Bottom
- Triple Bottom
- Triple Top
- Triple Top
- All
- All
- Buy
- Sale
- All
- 1
- 2
- 3
- 4
- 5
Teratas Ganda
was formed on 05.05 at 14:24:52 (UTC+0)
signal strength 1 of 5
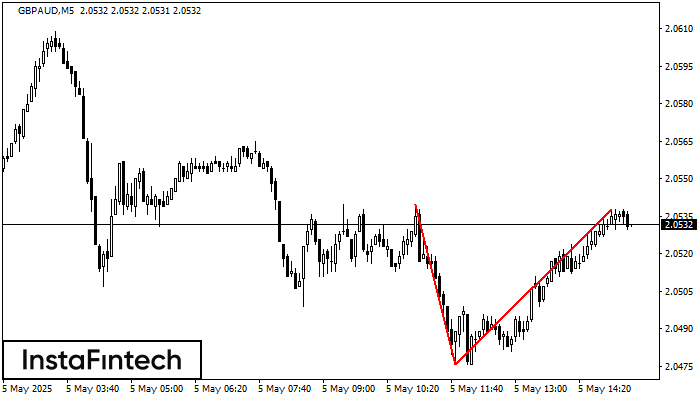
Pada grafik GBPAUD M5 pola reversal Teratas Ganda telah terbentuk. Karakteristik: batas atas 2.0538; batas bawah 2.0476; lebar pola 62 poin. Sinyal: tembusan ke batas bawah akan menyebabkan kelanjutan tren
Rangka waktu M5 dan M15 mungkin memiliki lebih dari titik entri yang keliru.
Open chart in a new window
Segitiga Simetris Bullish
was formed on 05.05 at 14:15:38 (UTC+0)
signal strength 1 of 5
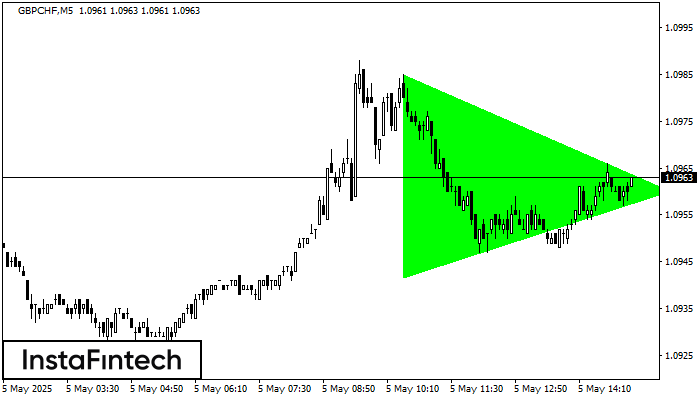
Menurut Grafik dari M5, GBPCHF dibentuk pola Segitiga Simetris Bullish, yang menunjukkan tren akan berlanjut. Deksripsi. Batas atas dari pola menyentuh kordinat 1.0985/1.0960 dimana batas yang lebih rendah berada sepanjang
Rangka waktu M5 dan M15 mungkin memiliki lebih dari titik entri yang keliru.
Open chart in a new window
Teratas Ganda
was formed on 05.05 at 14:09:45 (UTC+0)
signal strength 1 of 5
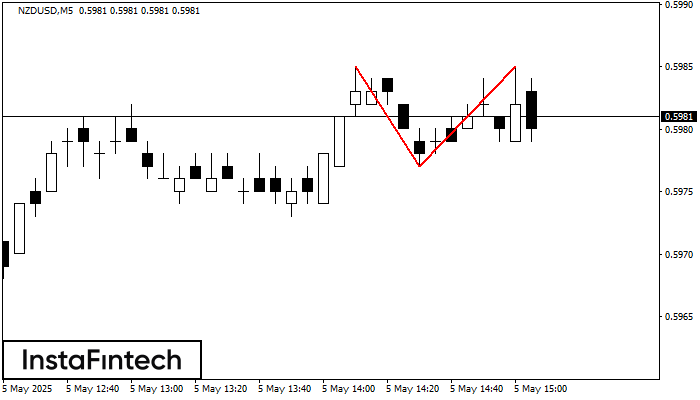
Pada grafik NZDUSD M5 pola reversal Teratas Ganda telah terbentuk. Karakteristik: batas atas 0.5985; batas bawah 0.5977; lebar pola 8 poin. Sinyal: tembusan ke batas bawah akan menyebabkan kelanjutan tren
Rangka waktu M5 dan M15 mungkin memiliki lebih dari titik entri yang keliru.
Open chart in a new window


