

Pola sebenarnya

Bullish Rectangle
was formed on 14.04 at 03:32:18 (UTC+0)
signal strength 1 of 5
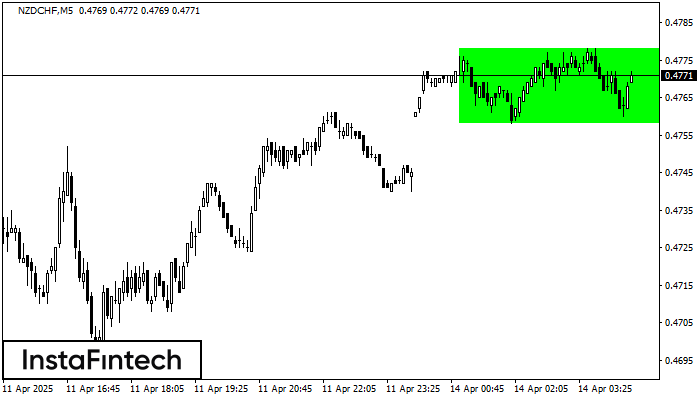
According to the chart of M5, NZDCHF formed the Bullish Rectangle. The pattern indicates a trend continuation. The upper border is 0.4778, the lower border is 0.4758. The signal means that a long position should be opened above the upper border 0.4778 of the Bullish Rectangle.
The M5 and M15 time frames may have more false entry points.
- All
- All
- Bearish Rectangle
- Bearish Symmetrical Triangle
- Bearish Symmetrical Triangle
- Bullish Rectangle
- Double Top
- Double Top
- Triple Bottom
- Triple Bottom
- Triple Top
- Triple Top
- All
- All
- Buy
- Sale
- All
- 1
- 2
- 3
- 4
- 5
বিয়ারিশ রেক্ট্যাঙ্গেল
was formed on 04.05 at 00:51:55 (UTC+0)
signal strength 3 of 5

M30 চার্ট অনুযায়ী, #Bitcoin বিয়ারিশ রেক্ট্যাঙ্গেল গঠন করেছে। এই প্যাটার্ন চলমান প্রবণতার ধারাবাহিকতা নির্দেশ করে। এটি দুটি স্তর নিয়ে গঠিত: 96456.78 - 0.00-এর রেজিস্ট্যান্স এবং 95805.26 - 95805.26-এর সাপোর্ট৷ 95805.26
Open chart in a new window
ডাবল বটম
was formed on 03.05 at 10:45:44 (UTC+0)
signal strength 2 of 5

M15 চার্টে, #Bitcoin-এর ডাবল বটম প্যাটার্নটি গঠিত হয়েছে। এই প্যাটার্নের গঠন এই সংকেত প্রদান করে যে মূল্য বিপরীতমুখী হয়ে নিম্নমুখী থেকে ঊর্ধ্বমুখী প্রবণতা প্রদর্শন করবে। এই প্যাটার্নের উপরের সীমানা 96350.17
M5 এবং M15 টাইম ফ্রেমে আরও ভুল এন্ট্রি পয়েন্ট থাকতে পারে।
Open chart in a new window
ডাবল বটম
was formed on 03.05 at 08:00:01 (UTC+0)
signal strength 3 of 5

M30 চার্টে, #Bitcoin-এর ডাবল বটম প্যাটার্নটি গঠিত হয়েছে। উপরের সীমানা হল 97860.25; নীচের সীমানা হল 96258.44। প্যাটার্নের প্রস্থ হল 156618 পয়েন্ট। 97860.25-এর উপরের সীমানা ভেদ করার ক্ষেত্রে, প্রবণতা পরিবর্তনের পূর্বাভাস
Open chart in a new window


