

Pola sebenarnya

Double Bottom
was formed on 14.04 at 01:30:09 (UTC+0)
signal strength 2 of 5
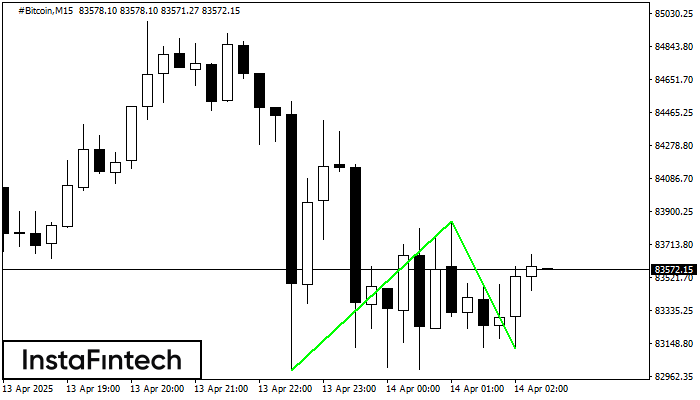
The Double Bottom pattern has been formed on #Bitcoin M15; the upper boundary is 83846.39; the lower boundary is 83118.34. The width of the pattern is 85123 points. In case of a break of the upper boundary 83846.39, a change in the trend can be predicted where the width of the pattern will coincide with the distance to a possible take profit level.
The M5 and M15 time frames may have more false entry points.
Lihat juga
- All
- All
- Bearish Rectangle
- Bearish Symmetrical Triangle
- Bearish Symmetrical Triangle
- Bullish Rectangle
- Double Top
- Double Top
- Triple Bottom
- Triple Bottom
- Triple Top
- Triple Top
- All
- All
- Buy
- Sale
- All
- 1
- 2
- 3
- 4
- 5
Segitiga Simetris Bullish
was formed on 06.05 at 01:24:48 (UTC+0)
signal strength 1 of 5
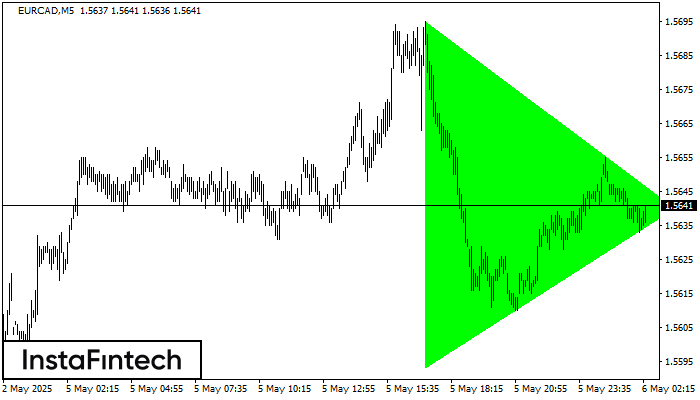
Menurut Grafik dari M5, EURCAD dibentuk pola Segitiga Simetris Bullish. Batas yang lebih rendah dari pola menyentuh kordinat 1.5593/1.5640 dimana batas atas berada sepanjang 1.5695/1.5640. Jika pola Segitiga Simetris Bullish
Rangka waktu M5 dan M15 mungkin memiliki lebih dari titik entri yang keliru.
Open chart in a new window
Persegi Bullish
was formed on 06.05 at 00:40:34 (UTC+0)
signal strength 1 of 5
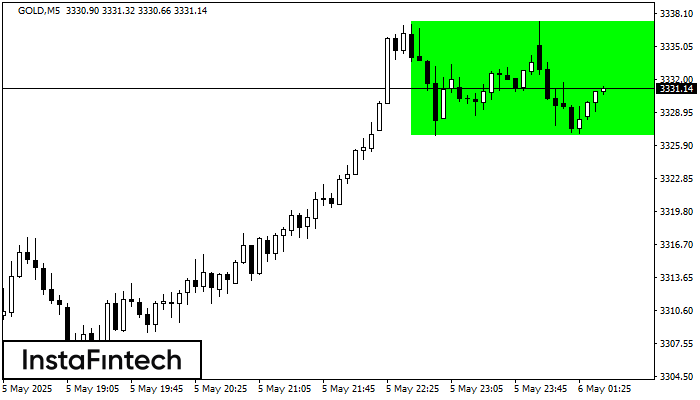
Menurut grafik dari M5, GOLD terbentuk Persegi Bullish. Jenis pola ini menunjukkan kelanjutan tren. Terdiri dari dua tingkat: resistance 3337.37 dan support 3326.83. Jika level resistance 3337.37 - 3337.37 ditembus
Rangka waktu M5 dan M15 mungkin memiliki lebih dari titik entri yang keliru.
Open chart in a new window
Bawah Triple
was formed on 06.05 at 00:20:44 (UTC+0)
signal strength 1 of 5

Pola Bawah Triple telah terbentuk pada grafik USDJPY M5. Fitur-fitur pola: garis bawah pola memiliki koordinat 143.80 dengan batas atas 143.80/143.76, proyeksi lebar adalah 13 poin. Pembentukan pola Bawah Triple
Rangka waktu M5 dan M15 mungkin memiliki lebih dari titik entri yang keliru.
Open chart in a new window


