

Pola sebenarnya

Double Bottom
was formed on 14.04 at 01:15:08 (UTC+0)
signal strength 1 of 5
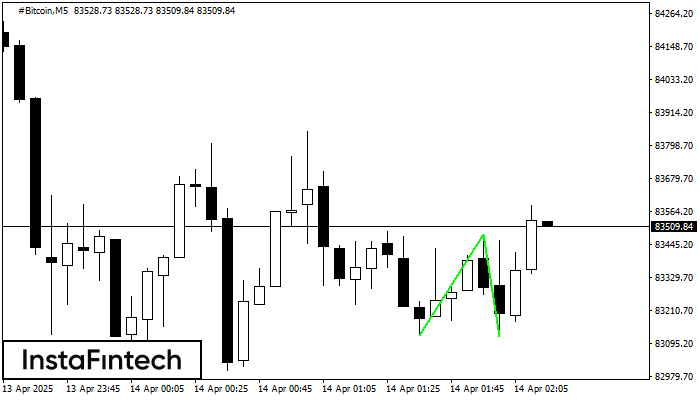
The Double Bottom pattern has been formed on #Bitcoin M5. Characteristics: the support level 83124.20; the resistance level 83483.08; the width of the pattern 35888 points. If the resistance level is broken, a change in the trend can be predicted with the first target point lying at the distance of 36474 points.
The M5 and M15 time frames may have more false entry points.
- All
- All
- Bearish Rectangle
- Bearish Symmetrical Triangle
- Bearish Symmetrical Triangle
- Bullish Rectangle
- Double Top
- Double Top
- Triple Bottom
- Triple Bottom
- Triple Top
- Triple Top
- All
- All
- Buy
- Sale
- All
- 1
- 2
- 3
- 4
- 5
Inverse Head and Shoulder
was formed on 02.05 at 02:00:07 (UTC+0)
signal strength 3 of 5
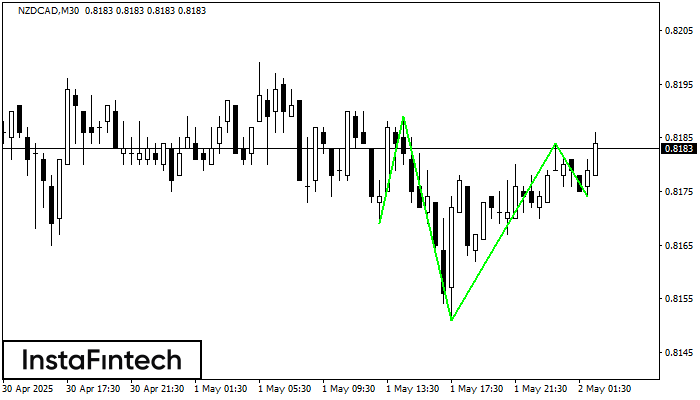
According to the chart of M30, NZDCAD formed the Inverse Head and Shoulder pattern. The Head’s top is set at 0.8184 while the median line of the Neck is found
Open chart in a new window
Inverse Head and Shoulder
was formed on 29.04 at 04:30:24 (UTC+0)
signal strength 3 of 5
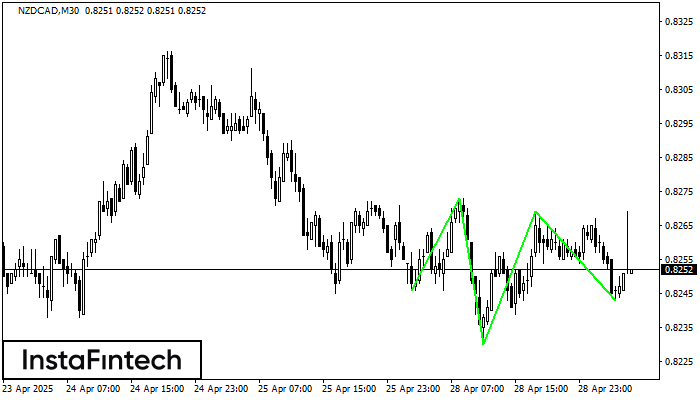
According to the chart of M30, NZDCAD formed the Inverse Head and Shoulder pattern. The Head’s top is set at 0.8269 while the median line of the Neck is found
Open chart in a new window
Inverse Head and Shoulder
was formed on 23.04 at 15:30:11 (UTC+0)
signal strength 3 of 5
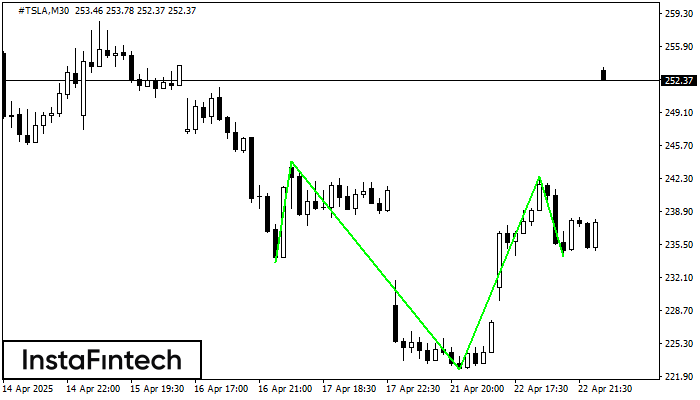
According to M30, #TSLA is shaping the technical pattern – the Inverse Head and Shoulder. In case the Neckline 244.08/242.52 is broken out, the instrument is likely to move toward
Open chart in a new window


