

Pola sebenarnya

Bullish Symmetrical Triangle
was formed on 08.04 at 06:53:55 (UTC+0)
signal strength 1 of 5
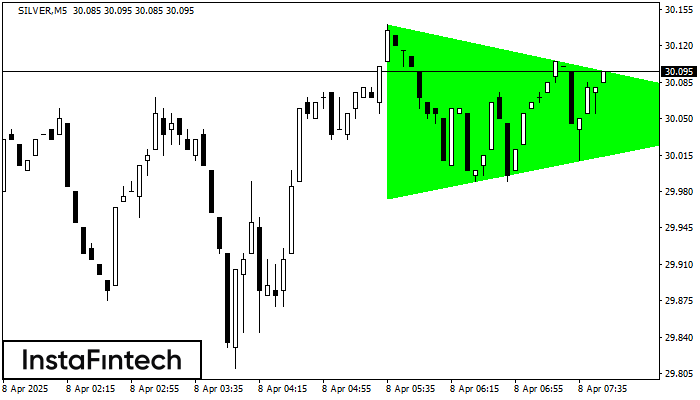
According to the chart of M5, SILVER formed the Bullish Symmetrical Triangle pattern. The lower border of the pattern touches the coordinates 29.97/30.05 whereas the upper border goes across 30.14/30.05. If the Bullish Symmetrical Triangle pattern is in progress, this evidently signals a further upward trend. In other words, in case the scenario comes true, the price of SILVER will breach the upper border to head for 30.07.
The M5 and M15 time frames may have more false entry points.
Lihat juga
- All
- All
- Bearish Rectangle
- Bearish Symmetrical Triangle
- Bearish Symmetrical Triangle
- Bullish Rectangle
- Double Top
- Double Top
- Triple Bottom
- Triple Bottom
- Triple Top
- Triple Top
- All
- All
- Buy
- Sale
- All
- 1
- 2
- 3
- 4
- 5
Bearish Rectangle
сформирован 09.05 в 04:05:35 (UTC+0)
сила сигнала 2 из 5
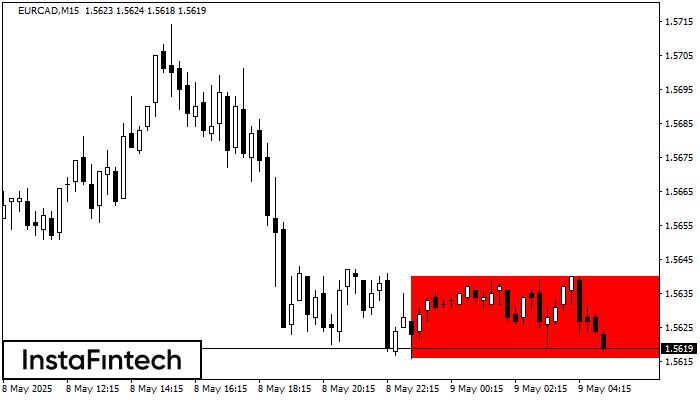
According to the chart of M15, EURCAD formed the Bearish Rectangle. The pattern indicates a trend continuation. The upper border is 1.5640, the lower border is 1.5616. The signal means
The M5 and M15 time frames may have more false entry points.
Открыть график инструмента в новом окне
Bearish Rectangle
сформирован 09.05 в 04:05:14 (UTC+0)
сила сигнала 3 из 5
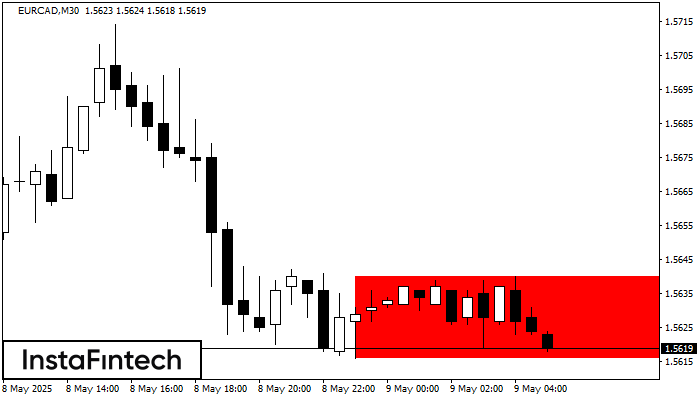
According to the chart of M30, EURCAD formed the Bearish Rectangle which is a pattern of a trend continuation. The pattern is contained within the following borders: lower border 1.5616
Открыть график инструмента в новом окне
Double Top
сформирован 09.05 в 03:59:58 (UTC+0)
сила сигнала 1 из 5
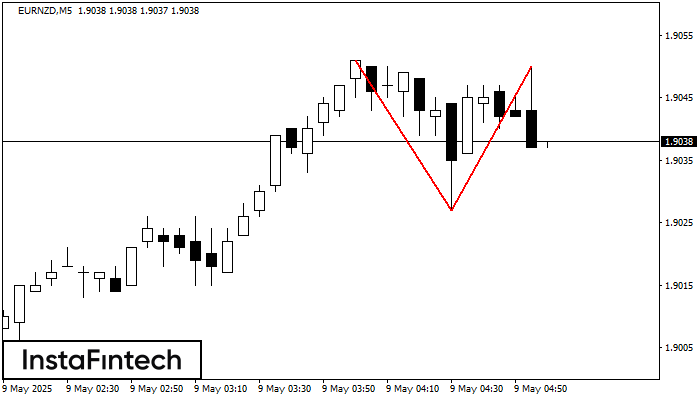
The Double Top reversal pattern has been formed on EURNZD M5. Characteristics: the upper boundary 1.9051; the lower boundary 1.9027; the width of the pattern is 23 points. Sell trades
The M5 and M15 time frames may have more false entry points.
Открыть график инструмента в новом окне


