

Pola sebenarnya

Head and Shoulders
was formed on 07.04 at 10:35:00 (UTC+0)
signal strength 1 of 5

The EURCAD M5 formed the Head and Shoulders pattern with the following features: The Head’s top is at 1.5734, the Neckline and the upward angle are at 1.5652/1.5644. The formation of this pattern can bring about changes in the current trend from bullish to bearish. In case the pattern triggers the expected changes, the price of EURCAD will go towards 1.5629.
The M5 and M15 time frames may have more false entry points.
Lihat juga
- All
- All
- Bearish Rectangle
- Bearish Symmetrical Triangle
- Bearish Symmetrical Triangle
- Bullish Rectangle
- Double Top
- Double Top
- Triple Bottom
- Triple Bottom
- Triple Top
- Triple Top
- All
- All
- Buy
- Sale
- All
- 1
- 2
- 3
- 4
- 5
Bearish Rectangle
was formed on 05.05 at 18:28:29 (UTC+0)
signal strength 1 of 5
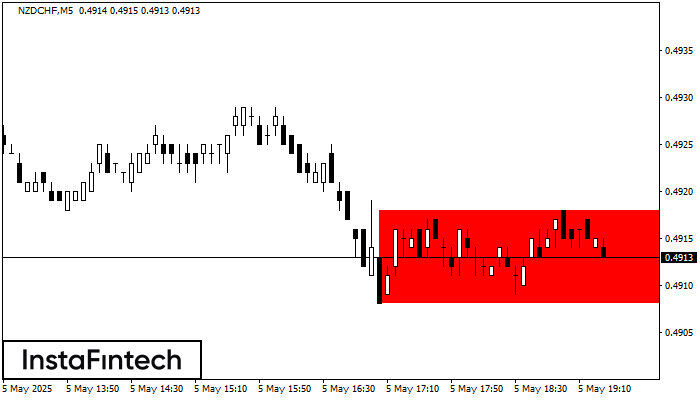
According to the chart of M5, NZDCHF formed the Bearish Rectangle. This type of a pattern indicates a trend continuation. It consists of two levels: resistance 0.4918 - 0.0000
The M5 and M15 time frames may have more false entry points.
Open chart in a new window
Bullish Symmetrical Triangle
was formed on 05.05 at 18:05:07 (UTC+0)
signal strength 1 of 5
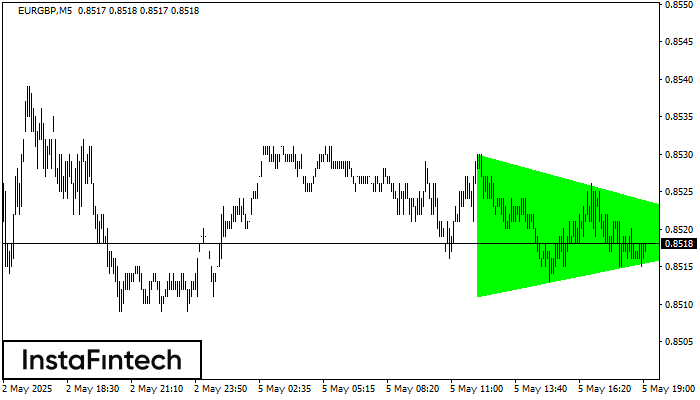
According to the chart of M5, EURGBP formed the Bullish Symmetrical Triangle pattern. The lower border of the pattern touches the coordinates 0.8511/0.8519 whereas the upper border goes across 0.8530/0.8519
The M5 and M15 time frames may have more false entry points.
Open chart in a new window
Double Bottom
was formed on 05.05 at 18:04:57 (UTC+0)
signal strength 1 of 5
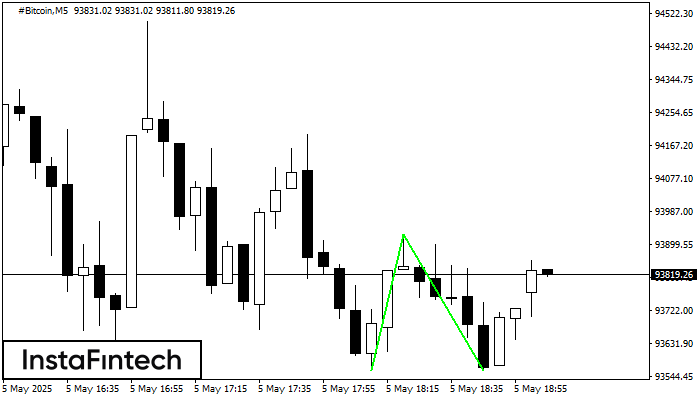
The Double Bottom pattern has been formed on #Bitcoin M5; the upper boundary is 93926.12; the lower boundary is 93560.62. The width of the pattern is 36607 points. In case
The M5 and M15 time frames may have more false entry points.
Open chart in a new window


