

Pola sebenarnya

Bullish Symmetrical Triangle
was formed on 07.04 at 05:53:18 (UTC+0)
signal strength 1 of 5
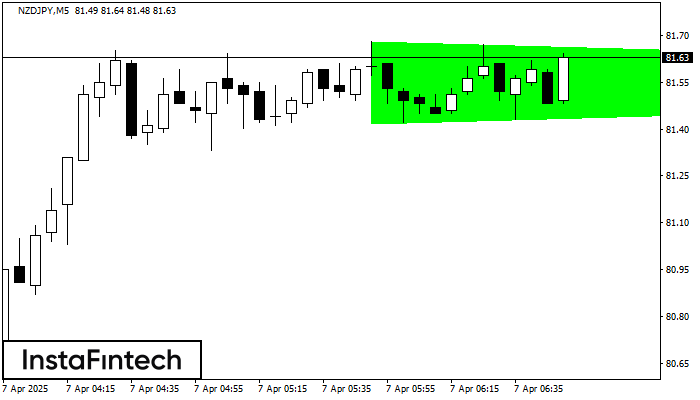
According to the chart of M5, NZDJPY formed the Bullish Symmetrical Triangle pattern. The lower border of the pattern touches the coordinates 81.42/81.55 whereas the upper border goes across 81.68/81.55. If the Bullish Symmetrical Triangle pattern is in progress, this evidently signals a further upward trend. In other words, in case the scenario comes true, the price of NZDJPY will breach the upper border to head for 81.70.
The M5 and M15 time frames may have more false entry points.
Lihat juga
- All
- All
- Bearish Rectangle
- Bearish Symmetrical Triangle
- Bearish Symmetrical Triangle
- Bullish Rectangle
- Double Top
- Double Top
- Triple Bottom
- Triple Bottom
- Triple Top
- Triple Top
- All
- All
- Buy
- Sale
- All
- 1
- 2
- 3
- 4
- 5
डबल बॉटम
was formed on 21.04 at 06:05:07 (UTC+0)
signal strength 1 of 5

डबल बॉटम पैटर्न USDJPY M5 पर बना है। यह फॉर्मेशन नीचे से ऊपर की ओर प्रवृत्ति के उलट होने का संकेत देता है। संकेत यह है कि पैटर्न 140.85 की
M5 और M15 समय सीमा में अधिक फाल्स एंट्री पॉइंट्स हो सकते हैं।
Open chart in a new window
डबल टॉप
was formed on 21.04 at 05:59:59 (UTC+0)
signal strength 1 of 5
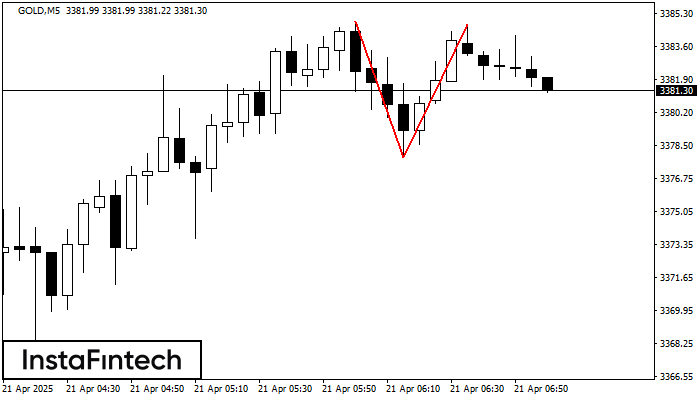
GOLD M5 पर डबल टॉप रीवर्सल पैटर्न बना है। विशेषताएं: ऊपरी सीमा 3384.89; निचली सीमा 3377.85; पैटर्न की चौड़ाई 687 पॉइंट्स है। सेल ट्रेडों को 3377.85 की निचली सीमा के
M5 और M15 समय सीमा में अधिक फाल्स एंट्री पॉइंट्स हो सकते हैं।
Open chart in a new window
डबल टॉप
was formed on 21.04 at 05:30:19 (UTC+0)
signal strength 1 of 5
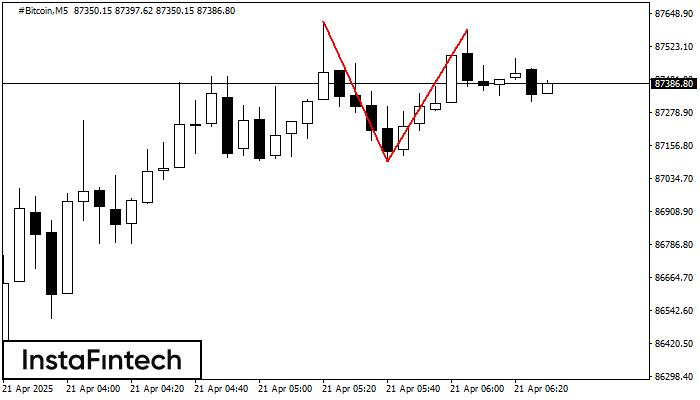
#Bitcoin M5 पर डबल टॉप रीवर्सल पैटर्न बना है। विशेषताएं: ऊपरी सीमा 87617.56; निचली सीमा 87098.24; पैटर्न की चौड़ाई 48893 पॉइंट्स है। सेल ट्रेडों को 87098.24 की निचली सीमा के
M5 और M15 समय सीमा में अधिक फाल्स एंट्री पॉइंट्स हो सकते हैं।
Open chart in a new window


