

Pola sebenarnya

Bullish Symmetrical Triangle
was formed on 07.04 at 05:17:14 (UTC+0)
signal strength 1 of 5
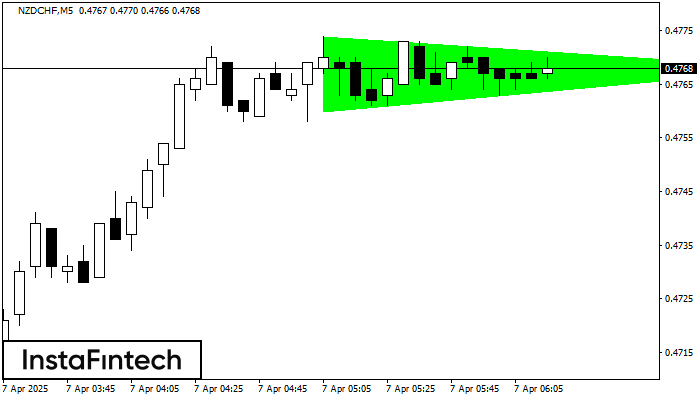
According to the chart of M5, NZDCHF formed the Bullish Symmetrical Triangle pattern. Description: This is the pattern of a trend continuation. 0.4774 and 0.4760 are the coordinates of the upper and lower borders respectively. The pattern width is measured on the chart at 14 pips. Outlook: If the upper border 0.4774 is broken, the price is likely to continue its move by 0.4783.
The M5 and M15 time frames may have more false entry points.
Lihat juga
- All
- All
- Bearish Rectangle
- Bearish Symmetrical Triangle
- Bearish Symmetrical Triangle
- Bullish Rectangle
- Double Top
- Double Top
- Triple Bottom
- Triple Bottom
- Triple Top
- Triple Top
- All
- All
- Buy
- Sale
- All
- 1
- 2
- 3
- 4
- 5
Segitiga Simetris Bullish
was formed on 21.04 at 04:56:25 (UTC+0)
signal strength 1 of 5

Menurut Grafik dari M5, AUDCAD dibentuk pola Segitiga Simetris Bullish, yang menunjukkan tren akan berlanjut. Deksripsi. Batas atas dari pola menyentuh kordinat 0.8838/0.8828 dimana batas yang lebih rendah berada sepanjang
Rangka waktu M5 dan M15 mungkin memiliki lebih dari titik entri yang keliru.
Open chart in a new window
Panji Bullish
was formed on 21.04 at 04:53:32 (UTC+0)
signal strength 1 of 5

Pola grafik Panji Bullish telah terbentuk di instrumen GBPAUD M5. Jenis pola ini terjadi pada kategori pola kelanjutan. Dalam kasus ini, jika kuotasi dapat menembus titik tertinggi, harga diperkirakan akan
Rangka waktu M5 dan M15 mungkin memiliki lebih dari titik entri yang keliru.
Open chart in a new window
Panji Bullish
was formed on 21.04 at 04:17:42 (UTC+0)
signal strength 3 of 5
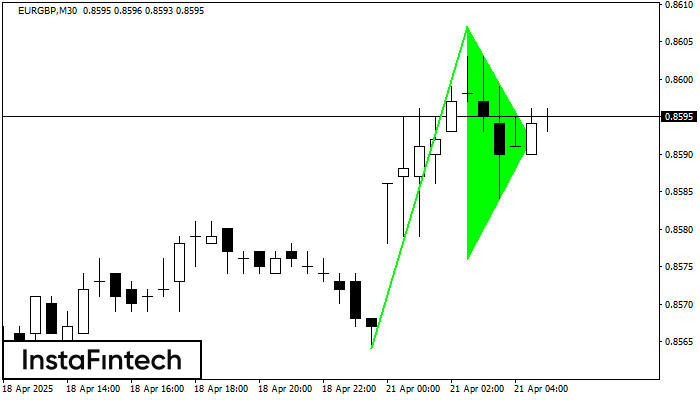
Pola grafik Panji Bullish telah terbentuk di instrumen EURGBP M30. Jenis pola ini terjadi pada kategori pola kelanjutan. Dalam kasus ini, jika kuotasi dapat menembus titik tertinggi, harga diperkirakan akan
Open chart in a new window


