

Pola sebenarnya

Bearish Symmetrical Triangle
was formed on 04.04 at 20:15:50 (UTC+0)
signal strength 1 of 5
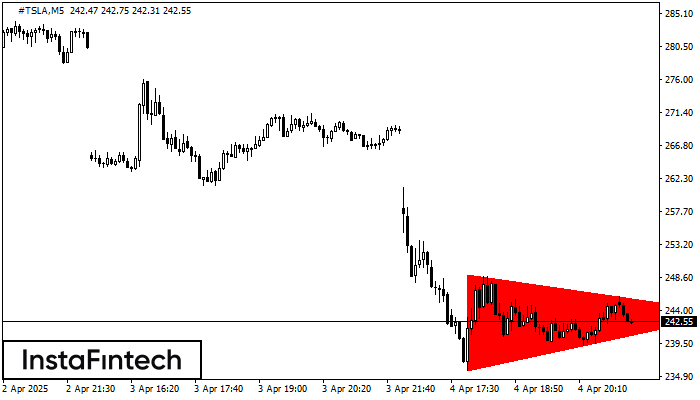
According to the chart of M5, #TSLA formed the Bearish Symmetrical Triangle pattern. Description: The lower border is 235.81/243.68 and upper border is 249.04/243.68. The pattern width is measured on the chart at -1323 pips. The formation of the Bearish Symmetrical Triangle pattern evidently signals a continuation of the downward trend. In other words, if the scenario comes true and #TSLA breaches the lower border, the price could continue its move toward 243.53.
The M5 and M15 time frames may have more false entry points.
Figure
- All
Instrument
- All
- Bearish Rectangle
- Bearish Symmetrical Triangle
- Bearish Symmetrical Triangle
- Bullish Rectangle
- Double Top
- Double Top
- Triple Bottom
- Triple Bottom
- Triple Top
- Triple Top
Timeframe
- All
Trend
- All
- Buy
- Sale
Signal Strength
- All
- 1
- 2
- 3
- 4
- 5


