

Pola sebenarnya

Triple Bottom
was formed on 04.04 at 19:40:28 (UTC+0)
signal strength 1 of 5
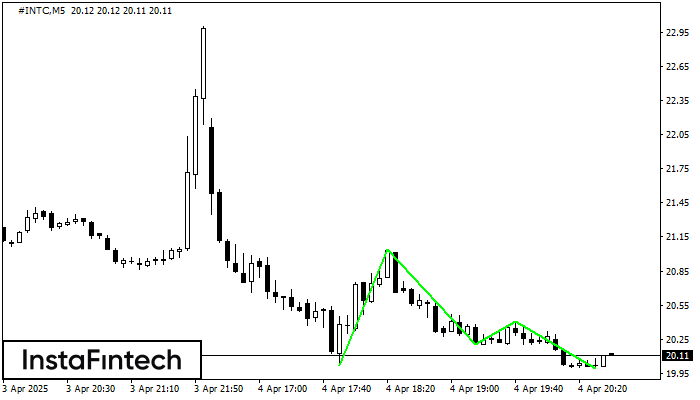
The Triple Bottom pattern has formed on the chart of #INTC M5. Features of the pattern: The lower line of the pattern has coordinates 21.04 with the upper limit 21.04/20.41, the projection of the width is 102 points. The formation of the Triple Bottom pattern most likely indicates a change in the trend from downward to upward. This means that in the event of a breakdown of the resistance level 20.02, the price is most likely to continue the upward movement.
The M5 and M15 time frames may have more false entry points.
Lihat juga
- All
- All
- Bearish Rectangle
- Bearish Symmetrical Triangle
- Bearish Symmetrical Triangle
- Bullish Rectangle
- Double Top
- Double Top
- Triple Bottom
- Triple Bottom
- Triple Top
- Triple Top
- All
- All
- Buy
- Sale
- All
- 1
- 2
- 3
- 4
- 5
Segitiga Simetris Bearish
was formed on 01.05 at 20:55:45 (UTC+0)
signal strength 1 of 5
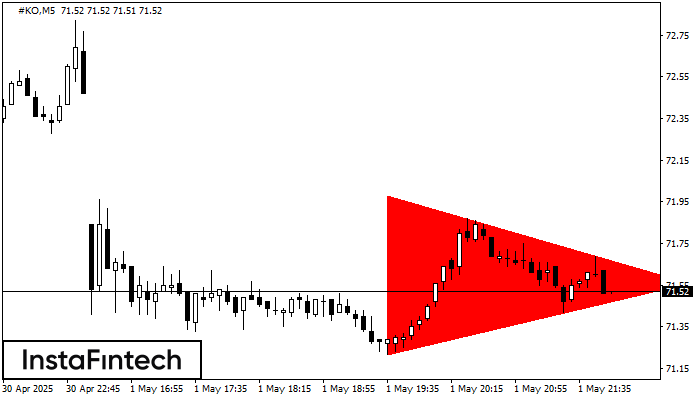
Menurut Grafik dari M5, #KO dibentuk pola Segitiga Simetris Bearish. Pola ini mengisyaratkan tren penurunan lebih lanjut jika terdapat batas yang lebih rendah 71.22 ditembus. Disini, sebuah keuntungan hipotetis akan
Rangka waktu M5 dan M15 mungkin memiliki lebih dari titik entri yang keliru.
Open chart in a new window
Bawah Ganda
was formed on 01.05 at 20:45:19 (UTC+0)
signal strength 2 of 5
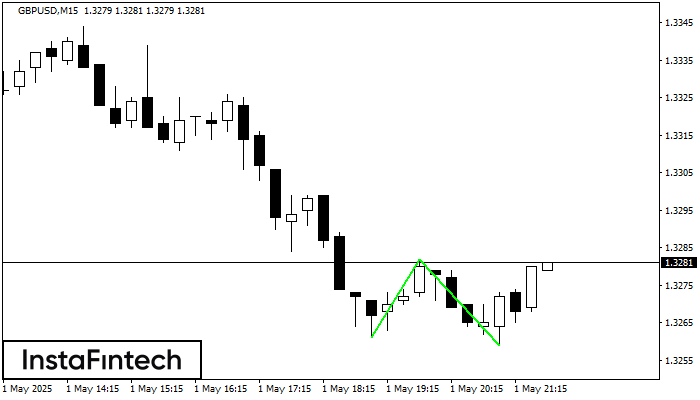
Pola Bawah Ganda telah terbentuk pada GBPUSD M15; batas atas di 1.3282; batas bawah di 1.3259. Lebar pola sebesar 21 poin. Jika harga menembus batas atas 1.3282, Perubahan dalam tren
Rangka waktu M5 dan M15 mungkin memiliki lebih dari titik entri yang keliru.
Open chart in a new window
Teratas Ganda
was formed on 01.05 at 20:30:19 (UTC+0)
signal strength 1 of 5
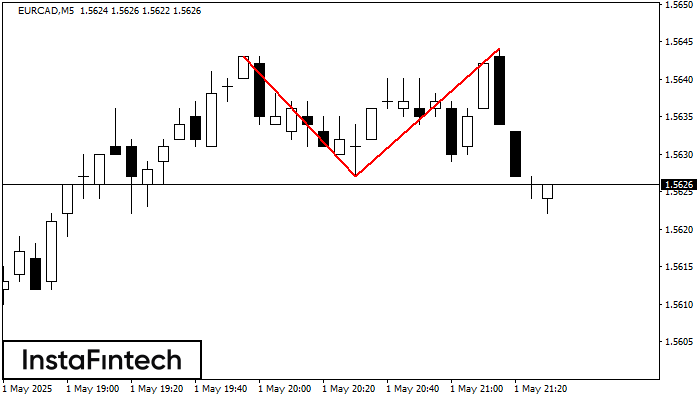
Pada grafik EURCAD M5 pola reversal Teratas Ganda telah terbentuk. Karakteristik: batas atas 1.5644; batas bawah 1.5627; lebar pola 17 poin. Sinyal: tembusan ke batas bawah akan menyebabkan kelanjutan tren
Rangka waktu M5 dan M15 mungkin memiliki lebih dari titik entri yang keliru.
Open chart in a new window


