

Pola sebenarnya

Bearish Rectangle
was formed on 04.04 at 19:12:06 (UTC+0)
signal strength 3 of 5
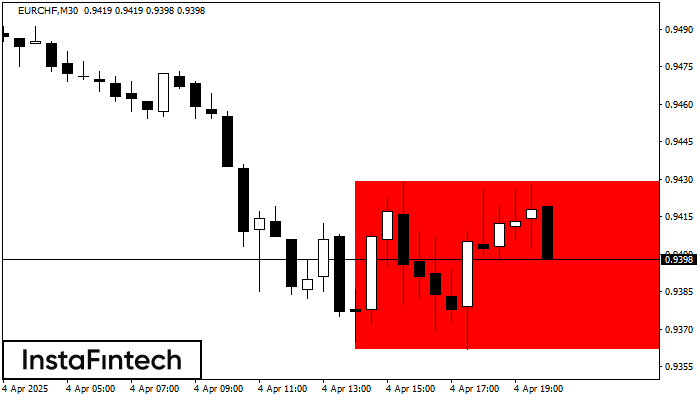
According to the chart of M30, EURCHF formed the Bearish Rectangle. This type of a pattern indicates a trend continuation. It consists of two levels: resistance 0.9429 - 0.0000 and support 0.9362 – 0.9362. In case the resistance level 0.9362 - 0.9362 is broken, the instrument is likely to follow the bearish trend.
Lihat juga
- All
- All
- Bearish Rectangle
- Bearish Symmetrical Triangle
- Bearish Symmetrical Triangle
- Bullish Rectangle
- Double Top
- Double Top
- Triple Bottom
- Triple Bottom
- Triple Top
- Triple Top
- All
- All
- Buy
- Sale
- All
- 1
- 2
- 3
- 4
- 5
Persegi Bullish
was formed on 06.05 at 14:32:12 (UTC+0)
signal strength 2 of 5
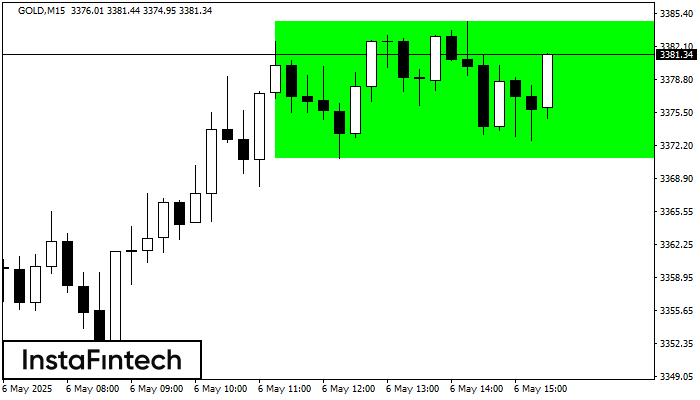
Menurut grafik dari M15, GOLD terbentuk Persegi Bullish yang merupakan pola dari kelanjutan tren. Pola terkandung dalam batas berikut: batas yang lebih rendah 3370.94 – 3370.94 dan batas atas 3384.62
Rangka waktu M5 dan M15 mungkin memiliki lebih dari titik entri yang keliru.
Open chart in a new window
Teratas Ganda
was formed on 06.05 at 14:30:09 (UTC+0)
signal strength 3 of 5
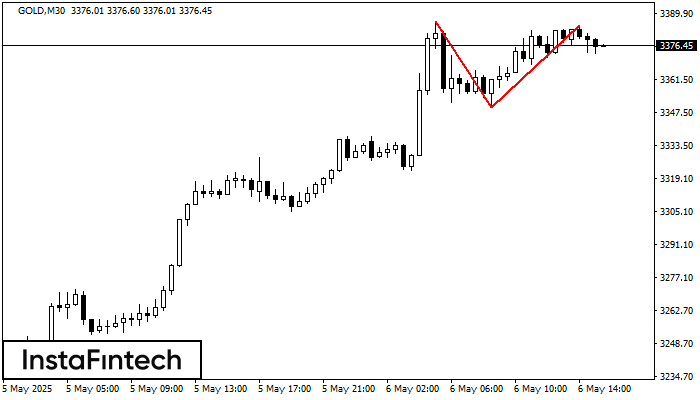
Pada grafik GOLD M30 pola reversal Teratas Ganda telah terbentuk. Karakteristik: batas atas 3384.62; batas bawah 3349.72; lebar pola 3490 poin. Sinyal: tembusan ke batas bawah akan menyebabkan kelanjutan tren
Open chart in a new window
Segitiga Simetris Bullish
was formed on 06.05 at 14:20:53 (UTC+0)
signal strength 1 of 5
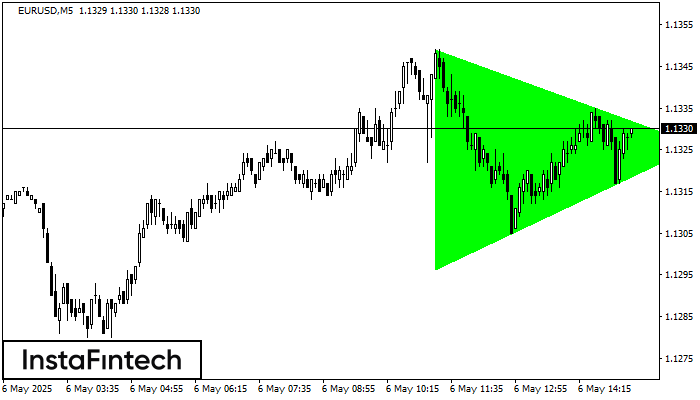
Menurut Grafik dari M5, EURUSD dibentuk pola Segitiga Simetris Bullish. Deskripsi: Ini merupakan pola dari kelanjutan tren. 1.1349 dan 1.1296 adalah kordinat masing-masing dari batas atas dan lebih rendah. Lebar
Rangka waktu M5 dan M15 mungkin memiliki lebih dari titik entri yang keliru.
Open chart in a new window


