

Pola sebenarnya

Triple Top
was formed on 04.04 at 16:55:17 (UTC+0)
signal strength 1 of 5
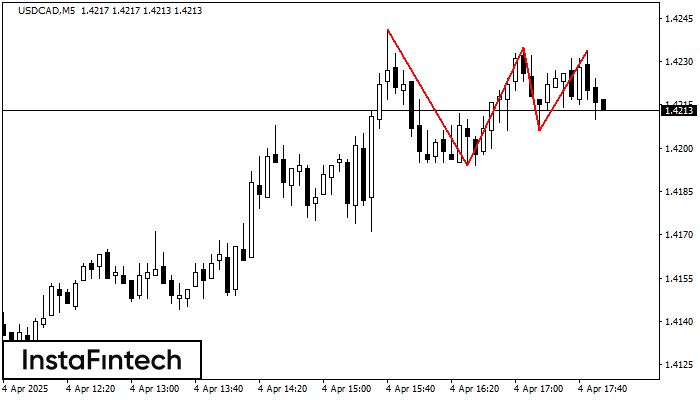
On the chart of the USDCAD M5 trading instrument, the Triple Top pattern that signals a trend change has formed. It is possible that after formation of the third peak, the price will try to break through the resistance level 1.4194, where we advise to open a trading position for sale. Take profit is the projection of the pattern’s width, which is 47 points.
The M5 and M15 time frames may have more false entry points.
Lihat juga
- All
- All
- Bearish Rectangle
- Bearish Symmetrical Triangle
- Bearish Symmetrical Triangle
- Bullish Rectangle
- Double Top
- Double Top
- Triple Bottom
- Triple Bottom
- Triple Top
- Triple Top
- All
- All
- Buy
- Sale
- All
- 1
- 2
- 3
- 4
- 5
Bawah Triple
was formed on 06.05 at 03:00:35 (UTC+0)
signal strength 4 of 5

Pola Bawah Triple telah terbentuk pada GBPCHF H1. Pola tersebut memiliki karakteristik sebagai berikut: level resistance 1.0997/1.0988; level support 1.0919/1.0919; dengan lebar 78 poin. Jika terjadi pemecahan (breakdown) pada level
Open chart in a new window
Bawah Triple
was formed on 06.05 at 03:00:33 (UTC+0)
signal strength 4 of 5
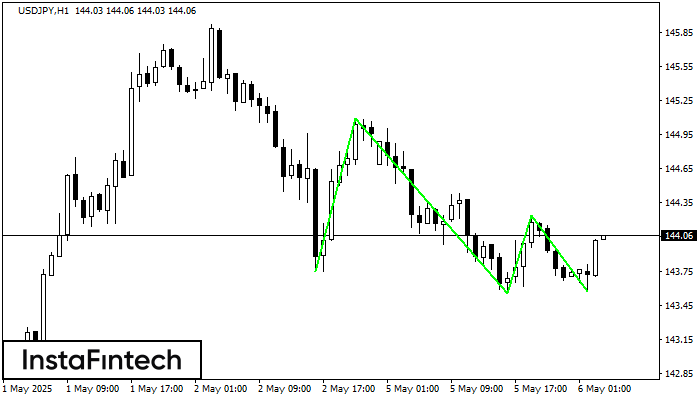
Pola Bawah Triple telah terbentuk pada grafik USDJPY H1. Fitur-fitur pola: garis bawah pola memiliki koordinat 145.09 dengan batas atas 145.09/144.24, proyeksi lebar adalah 134 poin. Pembentukan pola Bawah Triple
Open chart in a new window
Bawah Triple
was formed on 06.05 at 03:00:33 (UTC+0)
signal strength 4 of 5
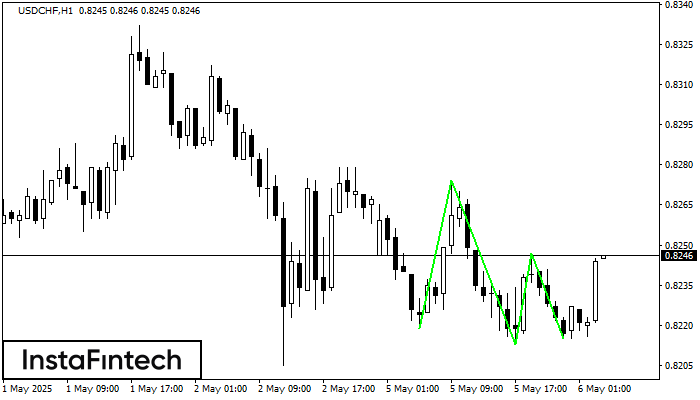
Pola Bawah Triple telah terbentuk pada grafik instrumen trading USDCHF H1. Pola tersebut menandakan perubahan dalam trend dari menurun menjadi naik jika terjadi pemecahan (breakdown) 0.8274/0.8247
Open chart in a new window


