

Pola sebenarnya

Bearish Symmetrical Triangle
was formed on 03.04 at 04:24:38 (UTC+0)
signal strength 1 of 5
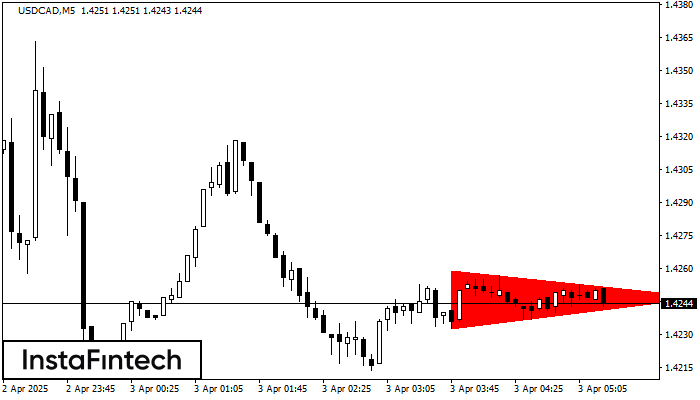
According to the chart of M5, USDCAD formed the Bearish Symmetrical Triangle pattern. Trading recommendations: A breach of the lower border 1.4233 is likely to encourage a continuation of the downward trend.
The M5 and M15 time frames may have more false entry points.
- All
- All
- Bearish Rectangle
- Bearish Symmetrical Triangle
- Bearish Symmetrical Triangle
- Bullish Rectangle
- Double Top
- Double Top
- Triple Bottom
- Triple Bottom
- Triple Top
- Triple Top
- All
- All
- Buy
- Sale
- All
- 1
- 2
- 3
- 4
- 5
Bearish Symmetrical Triangle
was formed on 23.04 at 13:22:55 (UTC+0)
signal strength 1 of 5

According to the chart of M5, EURJPY formed the Bearish Symmetrical Triangle pattern. Description: The lower border is 161.15/161.86 and upper border is 162.37/161.86. The pattern width is measured
The M5 and M15 time frames may have more false entry points.
Open chart in a new window
Triple Bottom
was formed on 23.04 at 12:15:11 (UTC+0)
signal strength 2 of 5

The Triple Bottom pattern has formed on the chart of the USDJPY M15 trading instrument. The pattern signals a change in the trend from downwards to upwards in the case
The M5 and M15 time frames may have more false entry points.
Open chart in a new window
Double Bottom
was formed on 23.04 at 12:00:11 (UTC+0)
signal strength 2 of 5

The Double Bottom pattern has been formed on USDJPY M15; the upper boundary is 141.96; the lower boundary is 141.59. The width of the pattern is 41 points. In case
The M5 and M15 time frames may have more false entry points.
Open chart in a new window


