

Pola sebenarnya

Double Top
was formed on 02.04 at 19:25:39 (UTC+0)
signal strength 1 of 5
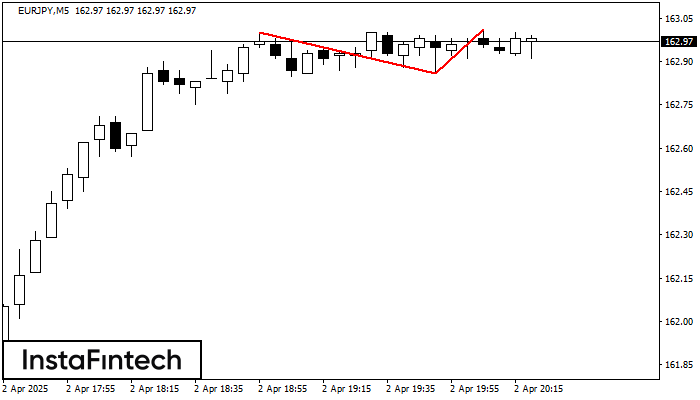
On the chart of EURJPY M5 the Double Top reversal pattern has been formed. Characteristics: the upper boundary 163.01; the lower boundary 162.86; the width of the pattern 15 points. The signal: a break of the lower boundary will cause continuation of the downward trend targeting the 162.71 level.
The M5 and M15 time frames may have more false entry points.
- All
- All
- Bearish Rectangle
- Bearish Symmetrical Triangle
- Bearish Symmetrical Triangle
- Bullish Rectangle
- Double Top
- Double Top
- Triple Bottom
- Triple Bottom
- Triple Top
- Triple Top
- All
- All
- Buy
- Sale
- All
- 1
- 2
- 3
- 4
- 5
Bawah Ganda
was formed on 07.05 at 12:39:47 (UTC+0)
signal strength 1 of 5
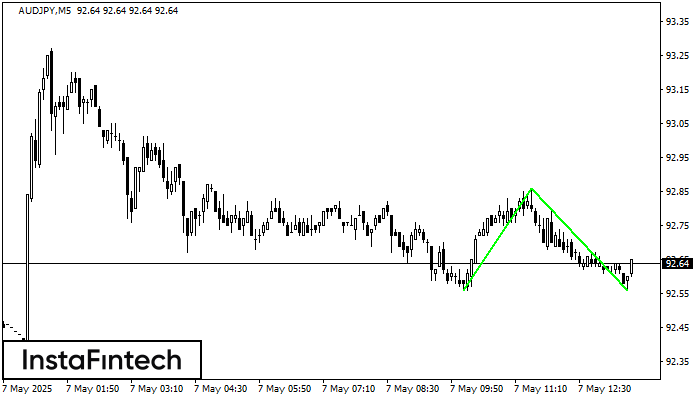
Pola Bawah Ganda telah terbentuk pada AUDJPY M5; batas atas di 92.86; batas bawah di 92.56. Lebar pola sebesar 30 poin. Jika harga menembus batas atas 92.86, Perubahan dalam tren
Rangka waktu M5 dan M15 mungkin memiliki lebih dari titik entri yang keliru.
Open chart in a new window
Bawah Ganda
was formed on 07.05 at 12:20:04 (UTC+0)
signal strength 1 of 5
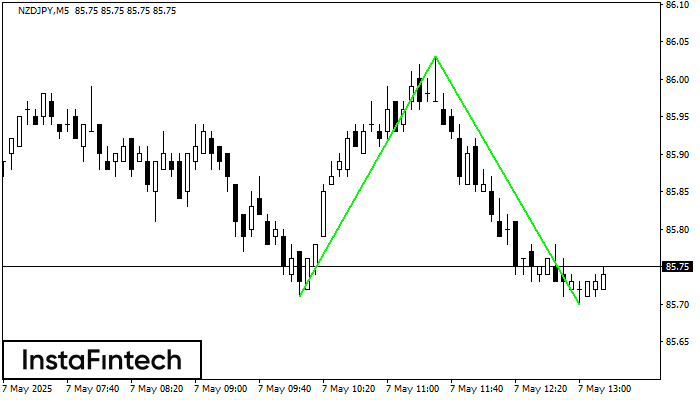
Pola Bawah Ganda telah terbentuk pada NZDJPY M5. Karakteristik: level support 85.71; level resistance 86.03; lebar pola 32 poin. Jika level resistance ditembus, perubahan dalam tren dapat diprediksi dengan target
Rangka waktu M5 dan M15 mungkin memiliki lebih dari titik entri yang keliru.
Open chart in a new window
Segitiga Simetris Bearish
was formed on 07.05 at 11:37:52 (UTC+0)
signal strength 2 of 5

Menurut Grafik dari M15, USDCHF dibentuk pola Segitiga Simetris Bearish. Pola ini mengisyaratkan tren penurunan lebih lanjut jika terdapat batas yang lebih rendah 0.8211 ditembus. Disini, sebuah keuntungan hipotetis akan
Rangka waktu M5 dan M15 mungkin memiliki lebih dari titik entri yang keliru.
Open chart in a new window


