

Pola sebenarnya

Double Bottom
was formed on 02.04 at 14:31:58 (UTC+0)
signal strength 2 of 5
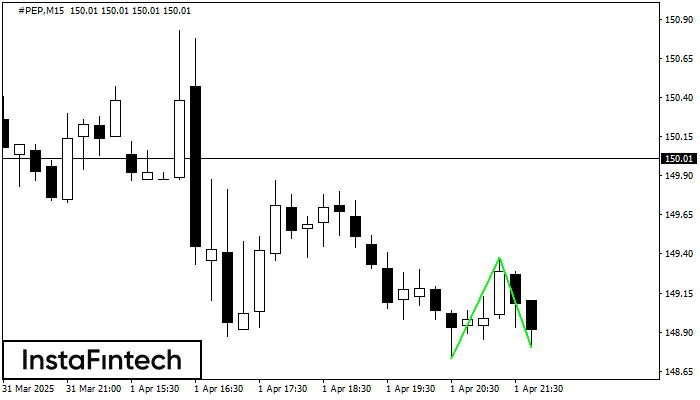
The Double Bottom pattern has been formed on #PEP M15; the upper boundary is 149.38; the lower boundary is 148.80. The width of the pattern is 65 points. In case of a break of the upper boundary 149.38, a change in the trend can be predicted where the width of the pattern will coincide with the distance to a possible take profit level.
The M5 and M15 time frames may have more false entry points.
- All
- All
- Bearish Rectangle
- Bearish Symmetrical Triangle
- Bearish Symmetrical Triangle
- Bullish Rectangle
- Double Top
- Double Top
- Triple Bottom
- Triple Bottom
- Triple Top
- Triple Top
- All
- All
- Buy
- Sale
- All
- 1
- 2
- 3
- 4
- 5
Segitiga Simetris Bullish
was formed on 22.04 at 00:32:37 (UTC+0)
signal strength 1 of 5

Menurut Grafik dari M5, GBPAUD dibentuk pola Segitiga Simetris Bullish. Batas yang lebih rendah dari pola menyentuh kordinat 2.0825/2.0852 dimana batas atas berada sepanjang 2.0880/2.0852. Jika pola Segitiga Simetris Bullish
Rangka waktu M5 dan M15 mungkin memiliki lebih dari titik entri yang keliru.
Open chart in a new window
Segitiga Simetris Bullish
was formed on 22.04 at 00:30:42 (UTC+0)
signal strength 1 of 5

Menurut Grafik dari M5, AUDCAD dibentuk pola Segitiga Simetris Bullish. Deskripsi: Ini merupakan pola dari kelanjutan tren. 0.8879 dan 0.8869 adalah kordinat masing-masing dari batas atas dan lebih rendah. Lebar
Rangka waktu M5 dan M15 mungkin memiliki lebih dari titik entri yang keliru.
Open chart in a new window
Segitiga Simetris Bearish
was formed on 22.04 at 00:27:05 (UTC+0)
signal strength 3 of 5

Menurut Grafik dari M30, USDJPY dibentuk pola Segitiga Simetris Bearish. Pola ini mengisyaratkan tren penurunan lebih lanjut jika terdapat batas yang lebih rendah 140.49 ditembus. Disini, sebuah keuntungan hipotetis akan
Open chart in a new window


