

Pola sebenarnya

Bullish Rectangle
was formed on 02.04 at 04:46:22 (UTC+0)
signal strength 1 of 5
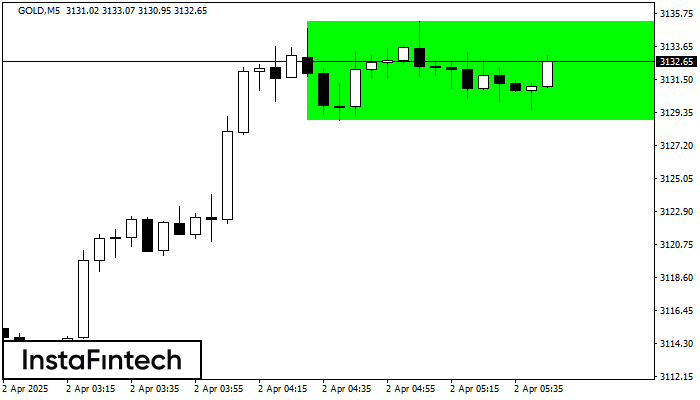
According to the chart of M5, GOLD formed the Bullish Rectangle which is a pattern of a trend continuation. The pattern is contained within the following borders: the lower border 3128.79 – 3128.79 and upper border 3135.25 – 3135.25. In case the upper border is broken, the instrument is likely to follow the upward trend.
The M5 and M15 time frames may have more false entry points.
- All
- All
- Bearish Rectangle
- Bearish Symmetrical Triangle
- Bearish Symmetrical Triangle
- Bullish Rectangle
- Double Top
- Double Top
- Triple Bottom
- Triple Bottom
- Triple Top
- Triple Top
- All
- All
- Buy
- Sale
- All
- 1
- 2
- 3
- 4
- 5
Bawah Ganda
was formed on 07.05 at 15:34:46 (UTC+0)
signal strength 1 of 5
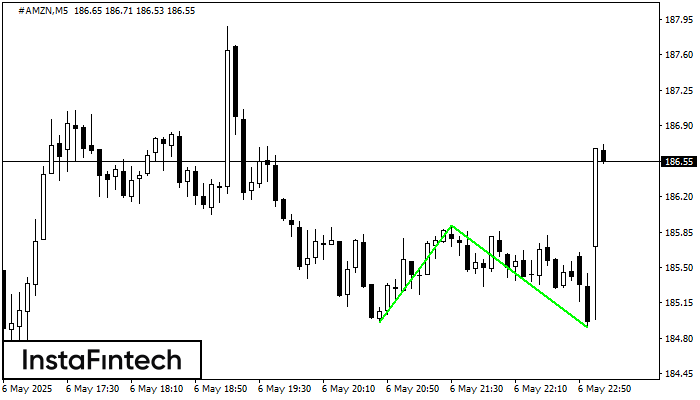
Pola Bawah Ganda telah terbentuk pada #AMZN M5; batas atas di 185.91; batas bawah di 184.91. Lebar pola sebesar 95 poin. Jika harga menembus batas atas 185.91, Perubahan dalam tren
Rangka waktu M5 dan M15 mungkin memiliki lebih dari titik entri yang keliru.
Open chart in a new window
Teratas Ganda
was formed on 07.05 at 15:30:06 (UTC+0)
signal strength 3 of 5
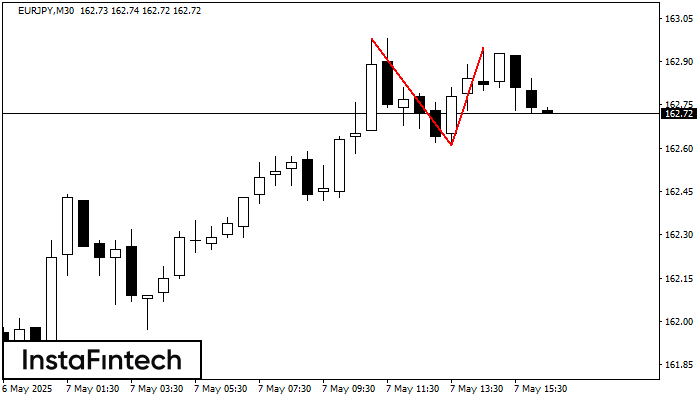
Pola Teratas Ganda telah terbentuk pada EURJPY M30. Pola ini menandakan bahwa tren telah berubah dari kenaikan menjadi penurunan. Mungkin, jika dasar pola di 162.61 ditembus, maka pergerakan menurun akan
Open chart in a new window
Segitiga Simetris Bearish
was formed on 07.05 at 15:29:43 (UTC+0)
signal strength 2 of 5
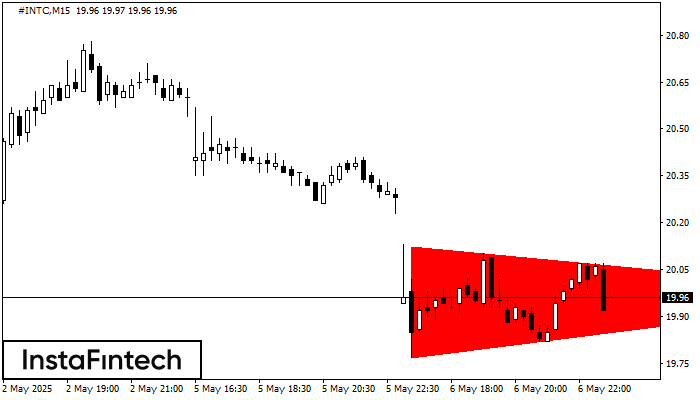
Menurut Grafik dari M15, #INTC dibentuk pola Segitiga Simetris Bearish. Rekomendasi Trading: Penembusan dari batas yang lebih rendah 19.77 kemungkinan akan mendorong kelanjutan dari tren penurunan
Rangka waktu M5 dan M15 mungkin memiliki lebih dari titik entri yang keliru.
Open chart in a new window


