

Pola sebenarnya

Bullish Rectangle
was formed on 01.04 at 20:31:48 (UTC+0)
signal strength 1 of 5
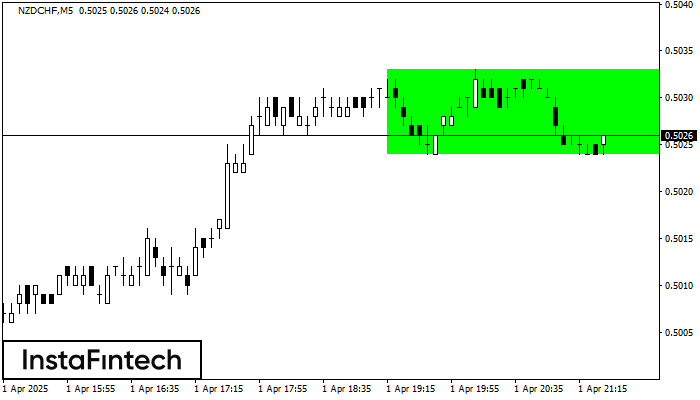
According to the chart of M5, NZDCHF formed the Bullish Rectangle. This type of a pattern indicates a trend continuation. It consists of two levels: resistance 0.5033 and support 0.5024. In case the resistance level 0.5033 - 0.5033 is broken, the instrument is likely to follow the bullish trend.
The M5 and M15 time frames may have more false entry points.
Lihat juga
- All
- All
- Bearish Rectangle
- Bearish Symmetrical Triangle
- Bearish Symmetrical Triangle
- Bullish Rectangle
- Double Top
- Double Top
- Triple Bottom
- Triple Bottom
- Triple Top
- Triple Top
- All
- All
- Buy
- Sale
- All
- 1
- 2
- 3
- 4
- 5
Bullish Symmetrical Triangle
was formed on 07.05 at 16:38:04 (UTC+0)
signal strength 1 of 5
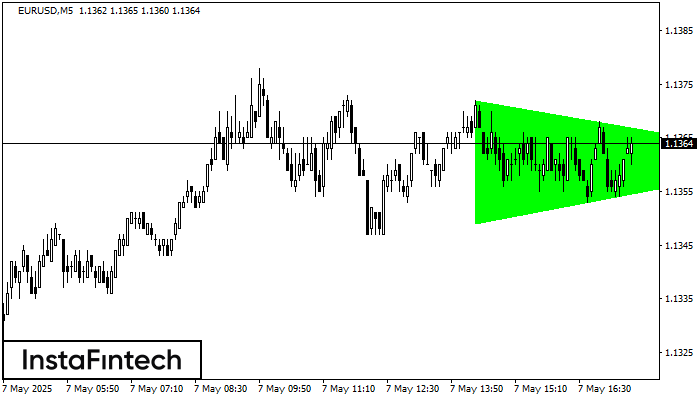
According to the chart of M5, EURUSD formed the Bullish Symmetrical Triangle pattern. The lower border of the pattern touches the coordinates 1.1349/1.1361 whereas the upper border goes across 1.1372/1.1361
The M5 and M15 time frames may have more false entry points.
Open chart in a new window
Bullish Rectangle
was formed on 07.05 at 16:29:50 (UTC+0)
signal strength 2 of 5
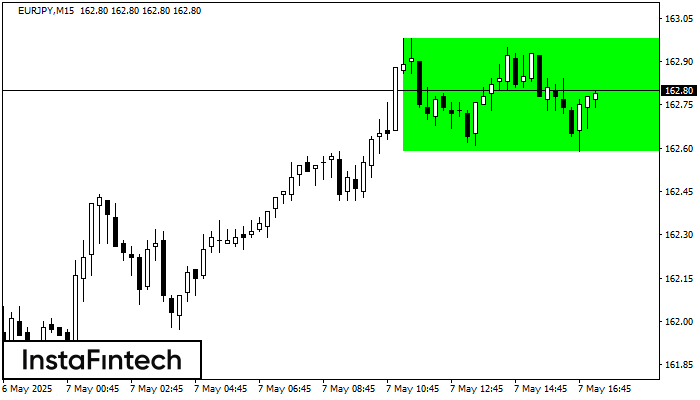
According to the chart of M15, EURJPY formed the Bullish Rectangle. This type of a pattern indicates a trend continuation. It consists of two levels: resistance 162.98 and support 162.59
The M5 and M15 time frames may have more false entry points.
Open chart in a new window
Bearish pennant
was formed on 07.05 at 16:23:49 (UTC+0)
signal strength 1 of 5
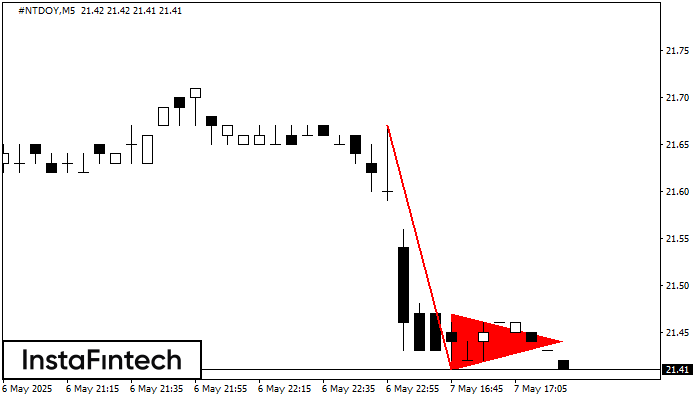
The Bearish pennant pattern has formed on the #NTDOY M5 chart. It signals potential continuation of the existing trend. Specifications: the pattern’s bottom has the coordinate of 21.41; the projection
The M5 and M15 time frames may have more false entry points.
Open chart in a new window


