

Pola sebenarnya

Double Top
was formed on 01.04 at 20:16:16 (UTC+0)
signal strength 2 of 5
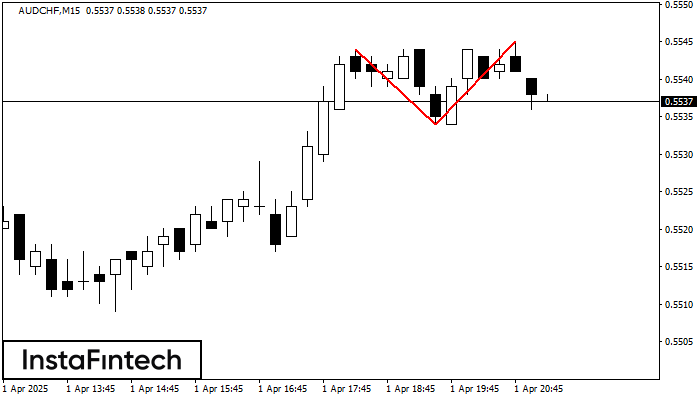
On the chart of AUDCHF M15 the Double Top reversal pattern has been formed. Characteristics: the upper boundary 0.5545; the lower boundary 0.5534; the width of the pattern 11 points. The signal: a break of the lower boundary will cause continuation of the downward trend targeting the 0.5512 level.
The M5 and M15 time frames may have more false entry points.
- All
- All
- Bearish Rectangle
- Bearish Symmetrical Triangle
- Bearish Symmetrical Triangle
- Bullish Rectangle
- Double Top
- Double Top
- Triple Bottom
- Triple Bottom
- Triple Top
- Triple Top
- All
- All
- Buy
- Sale
- All
- 1
- 2
- 3
- 4
- 5
Teratas Ganda
was formed on 16.04 at 03:00:17 (UTC+0)
signal strength 4 of 5
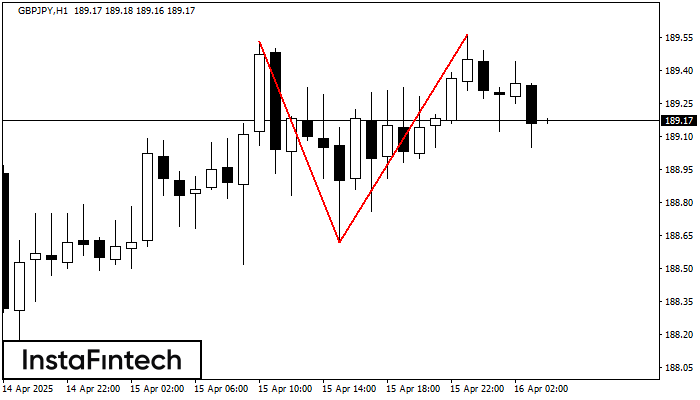
Pola reversal Teratas Ganda telah terbentuk pada GBPJPY H1. Karakteristik: batas atas 189.53; batas bawah 188.62; lebar pola 94 poin. Transaksi jual lebih baik dibuka di bawah batas bawah 188.62
Open chart in a new window
Segitiga Simetris Bearish
was formed on 16.04 at 02:00:48 (UTC+0)
signal strength 1 of 5

Menurut Grafik dari M5, NZDJPY dibentuk pola Segitiga Simetris Bearish. Deskripsi: Batas yang lebih rendah adalah 84.16/84.34 dan batas atas adalah 84.51/84.34. Lebar pola diukur dalam grafik di -35 pips
Rangka waktu M5 dan M15 mungkin memiliki lebih dari titik entri yang keliru.
Open chart in a new window
Persegi Bearish
was formed on 16.04 at 01:07:48 (UTC+0)
signal strength 1 of 5
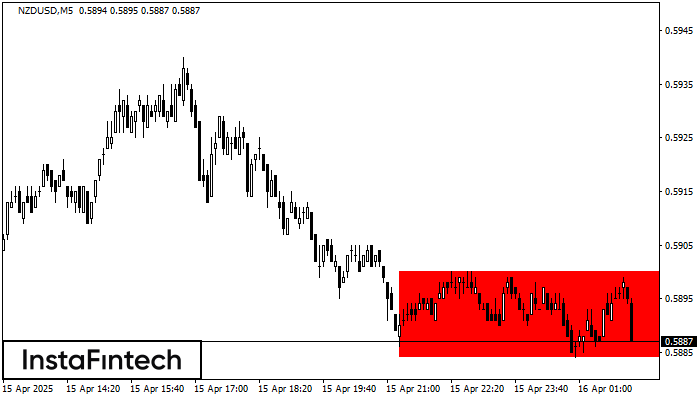
Menurut grafik dari M5, NZDUSD terbentuk Persegi Bearish. Pola menunjukkan kelanjutan tren. Batas atas adalah 0.5900, batas rendah adalah 0.5884. Sinyal berarti posisi jual harus dibuka setelah menetapkan harga dibawah
Rangka waktu M5 dan M15 mungkin memiliki lebih dari titik entri yang keliru.
Open chart in a new window

