

Pola sebenarnya

Bullish Symmetrical Triangle
was formed on 01.04 at 18:50:43 (UTC+0)
signal strength 1 of 5
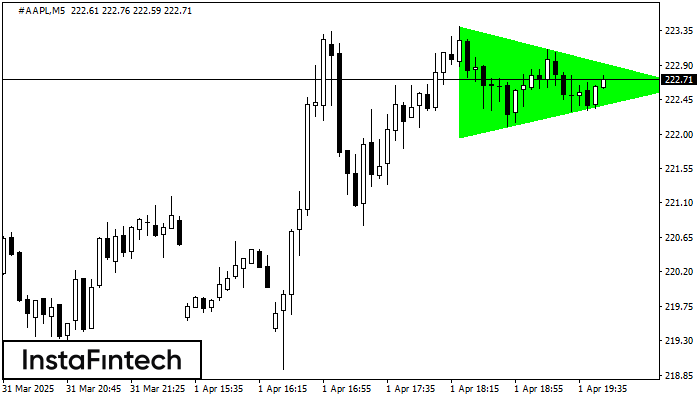
According to the chart of M5, #AAPL formed the Bullish Symmetrical Triangle pattern. The lower border of the pattern touches the coordinates 221.96/222.64 whereas the upper border goes across 223.40/222.64. If the Bullish Symmetrical Triangle pattern is in progress, this evidently signals a further upward trend. In other words, in case the scenario comes true, the price of #AAPL will breach the upper border to head for 222.79.
The M5 and M15 time frames may have more false entry points.
Lihat juga
- All
- All
- Bearish Rectangle
- Bearish Symmetrical Triangle
- Bearish Symmetrical Triangle
- Bullish Rectangle
- Double Top
- Double Top
- Triple Bottom
- Triple Bottom
- Triple Top
- Triple Top
- All
- All
- Buy
- Sale
- All
- 1
- 2
- 3
- 4
- 5
Persegi Bearish
was formed on 05.05 at 18:28:29 (UTC+0)
signal strength 1 of 5
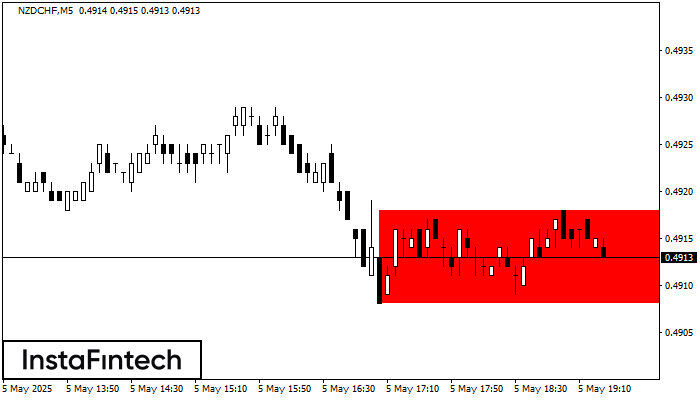
Menurut grafik dari M5, NZDCHF terbentuk Persegi Bearish. Jenis pola ini menunjukkan kelanjutan tren. Terdiri dari dua tingkat: resistance 0.4918 - 0.0000 dan support 0.4908 – 0.4908. Jika level resistance
Rangka waktu M5 dan M15 mungkin memiliki lebih dari titik entri yang keliru.
Open chart in a new window
Segitiga Simetris Bullish
was formed on 05.05 at 18:05:07 (UTC+0)
signal strength 1 of 5
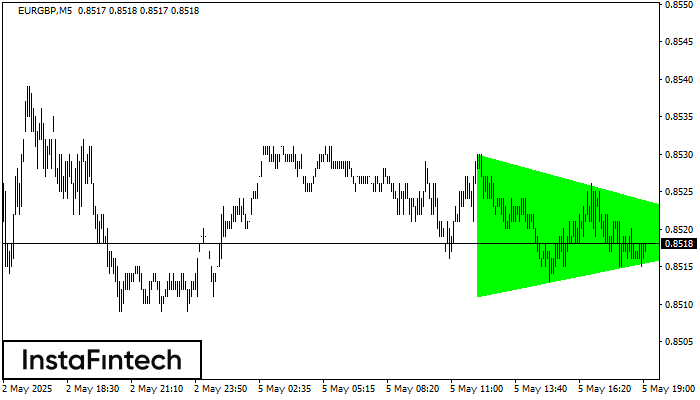
Menurut Grafik dari M5, EURGBP dibentuk pola Segitiga Simetris Bullish. Batas yang lebih rendah dari pola menyentuh kordinat 0.8511/0.8519 dimana batas atas berada sepanjang 0.8530/0.8519. Jika pola Segitiga Simetris Bullish
Rangka waktu M5 dan M15 mungkin memiliki lebih dari titik entri yang keliru.
Open chart in a new window
Bawah Ganda
was formed on 05.05 at 18:04:57 (UTC+0)
signal strength 1 of 5
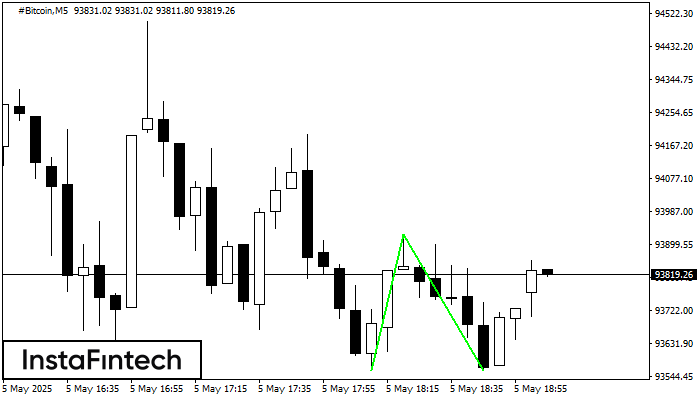
Pola Bawah Ganda telah terbentuk pada #Bitcoin M5; batas atas di 93926.12; batas bawah di 93560.62. Lebar pola sebesar 36607 poin. Jika harga menembus batas atas 93926.12, Perubahan dalam tren
Rangka waktu M5 dan M15 mungkin memiliki lebih dari titik entri yang keliru.
Open chart in a new window


