

Pola sebenarnya

Bullish Rectangle
was formed on 01.04 at 15:36:34 (UTC+0)
signal strength 1 of 5
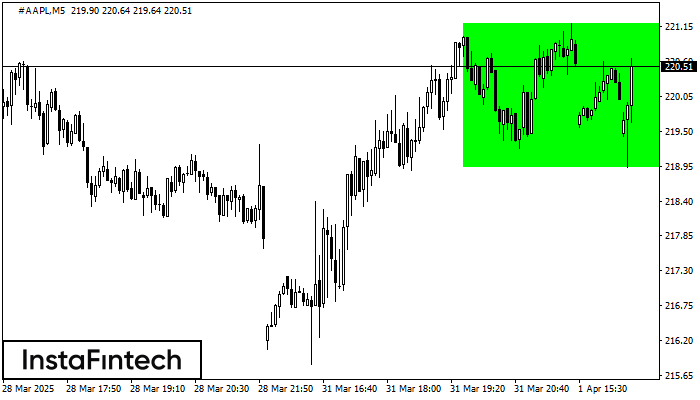
According to the chart of M5, #AAPL formed the Bullish Rectangle. This type of a pattern indicates a trend continuation. It consists of two levels: resistance 221.19 and support 218.93. In case the resistance level 221.19 - 221.19 is broken, the instrument is likely to follow the bullish trend.
The M5 and M15 time frames may have more false entry points.
Lihat juga
- All
- All
- Bearish Rectangle
- Bearish Symmetrical Triangle
- Bearish Symmetrical Triangle
- Bullish Rectangle
- Double Top
- Double Top
- Triple Bottom
- Triple Bottom
- Triple Top
- Triple Top
- All
- All
- Buy
- Sale
- All
- 1
- 2
- 3
- 4
- 5
বুলিশ সিমেট্রিকাল ট্রায়াঙ্গেল
was formed on 07.05 at 07:50:10 (UTC+0)
signal strength 2 of 5
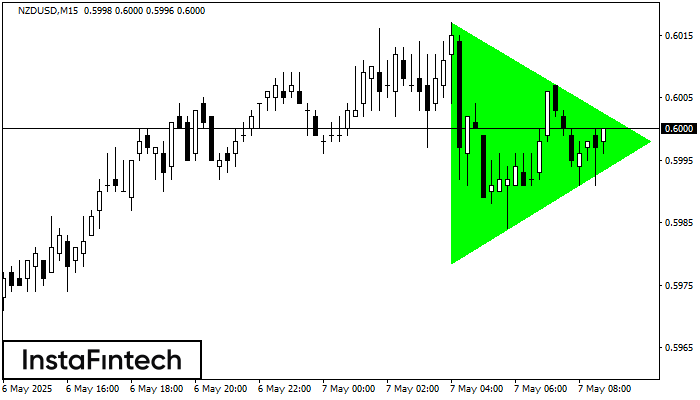
M15 চার্ট অনুযায়ী, NZDUSD বুলিশ সিমেট্রিকাল ট্রায়াঙ্গেল প্যাটার্ন গঠন করেছে। প্যাটার্নের নীচের সীমানা 0.5979/0.5998-এর কোঅর্ডিনেটগুলো স্পর্শ করেছে যেখানে উপরের সীমানাটি 0.6017/0.5998 জুড়ে যাচ্ছে৷ যদি বুলিশ সিমেট্রিকাল ট্রায়াঙ্গেল প্যাটার্নটি বজায় থাকে
M5 এবং M15 টাইম ফ্রেমে আরও ভুল এন্ট্রি পয়েন্ট থাকতে পারে।
Open chart in a new window
ডাবল টপ
was formed on 07.05 at 07:45:48 (UTC+0)
signal strength 2 of 5
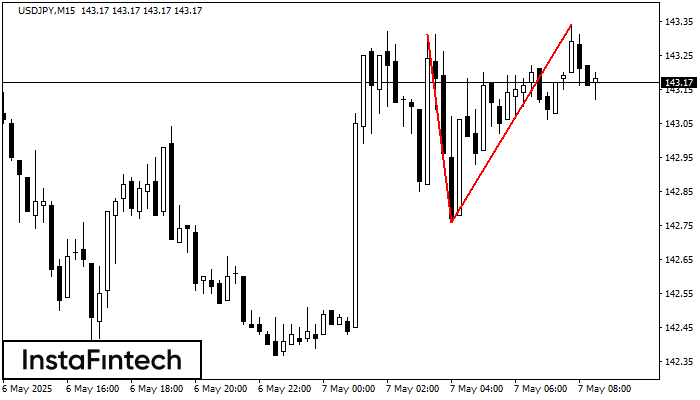
M15 চার্টে, USDJPY-এর ডাবল টপ রিভার্সাল বা বিপরীতমুখী প্যাটার্ন গঠিত হয়েছে। বৈশিষ্ট্য: উপরের সীমানা 143.31; নীচের সীমানা 142.76; প্যাটার্নের প্রস্থ হল 58 পয়েন্ট। 142.76 142.54 স্তরের দিকে সম্ভাব্য মুভমেন্টের সাথে
M5 এবং M15 টাইম ফ্রেমে আরও ভুল এন্ট্রি পয়েন্ট থাকতে পারে।
Open chart in a new window
ডাবল টপ
was formed on 07.05 at 07:45:08 (UTC+0)
signal strength 1 of 5
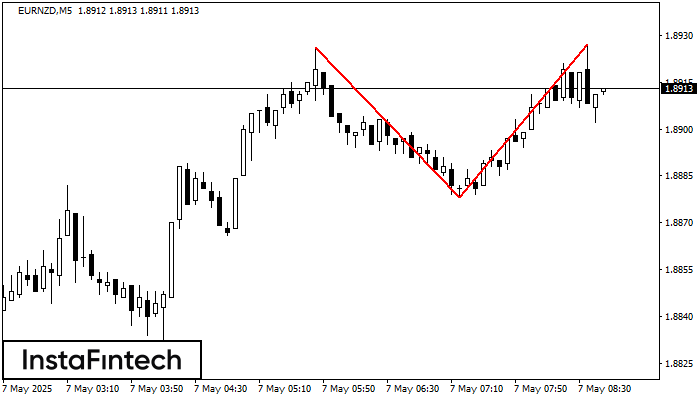
M5 চার্টে, EURNZD-এর ডাবল টপ রিভার্সাল বা বিপরীতমুখী প্যাটার্ন গঠিত হয়েছে। বৈশিষ্ট্য: উপরের সীমানা 1.8927; নীচের সীমানা 1.8878; প্যাটার্নের প্রস্থ 49 পয়েন্ট। সংকেত: নীচের সীমানা ব্রেক করা হলে 1.8863 স্তরের
M5 এবং M15 টাইম ফ্রেমে আরও ভুল এন্ট্রি পয়েন্ট থাকতে পারে।
Open chart in a new window


