

Pola sebenarnya

Bearish Symmetrical Triangle
was formed on 01.04 at 07:59:27 (UTC+0)
signal strength 1 of 5
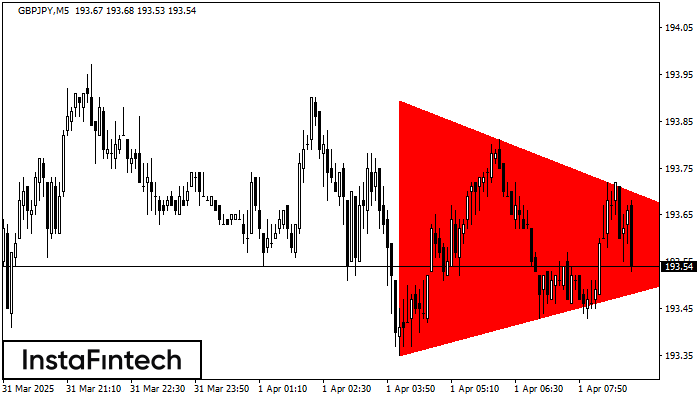
According to the chart of M5, GBPJPY formed the Bearish Symmetrical Triangle pattern. Description: The lower border is 193.35/193.57 and upper border is 193.89/193.57. The pattern width is measured on the chart at -54 pips. The formation of the Bearish Symmetrical Triangle pattern evidently signals a continuation of the downward trend. In other words, if the scenario comes true and GBPJPY breaches the lower border, the price could continue its move toward 193.42.
The M5 and M15 time frames may have more false entry points.
- All
- All
- Bearish Rectangle
- Bearish Symmetrical Triangle
- Bearish Symmetrical Triangle
- Bullish Rectangle
- Double Top
- Double Top
- Triple Bottom
- Triple Bottom
- Triple Top
- Triple Top
- All
- All
- Buy
- Sale
- All
- 1
- 2
- 3
- 4
- 5
Bawah Ganda
was formed on 06.05 at 21:35:15 (UTC+0)
signal strength 1 of 5
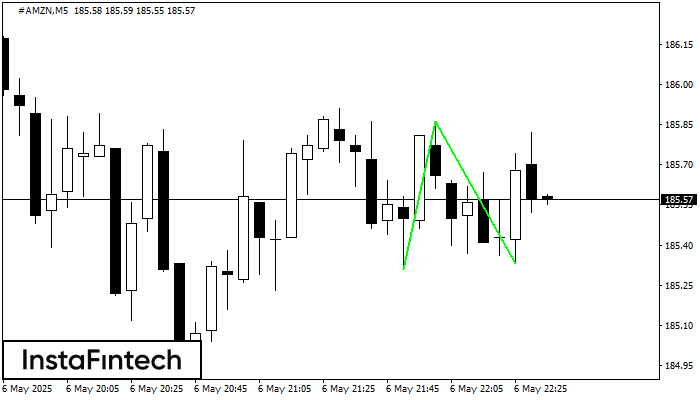
Pola Bawah Ganda telah terbentuk pada #AMZN M5. Karakteristik: level support 185.31; level resistance 185.86; lebar pola 55 poin. Jika level resistance ditembus, perubahan dalam tren dapat diprediksi dengan target
Rangka waktu M5 dan M15 mungkin memiliki lebih dari titik entri yang keliru.
Open chart in a new window
Segitiga Simetris Bullish
was formed on 06.05 at 21:02:39 (UTC+0)
signal strength 1 of 5
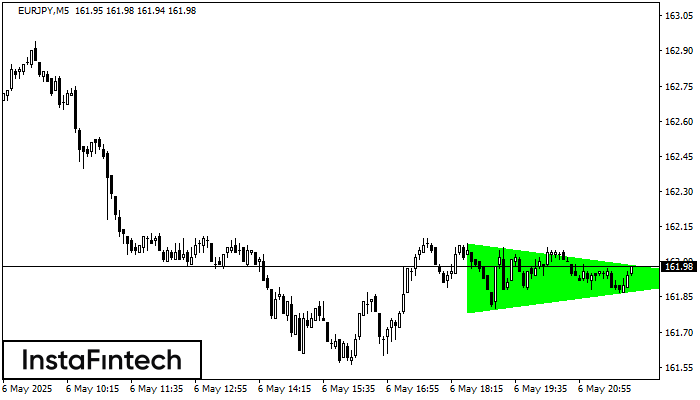
Menurut Grafik dari M5, EURJPY dibentuk pola Segitiga Simetris Bullish. Deskripsi: Ini merupakan pola dari kelanjutan tren. 162.08 dan 161.78 adalah kordinat masing-masing dari batas atas dan lebih rendah. Lebar
Rangka waktu M5 dan M15 mungkin memiliki lebih dari titik entri yang keliru.
Open chart in a new window
Persegi Bullish
was formed on 06.05 at 21:00:23 (UTC+0)
signal strength 3 of 5
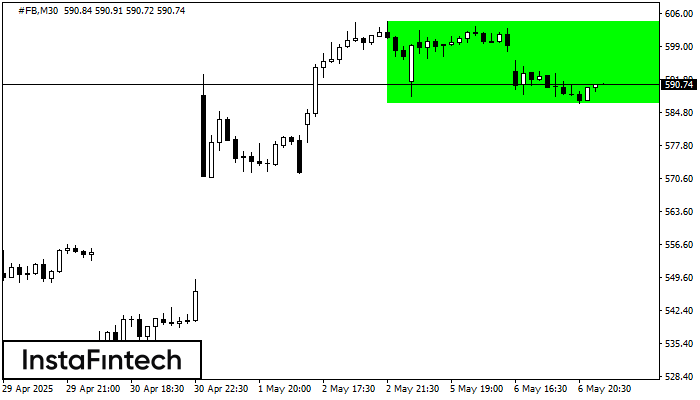
Menurut grafik dari M30, #FB terbentuk Persegi Bullish. Jenis pola ini menunjukkan kelanjutan tren. Terdiri dari dua tingkat: resistance 604.25 dan support 586.62. Jika level resistance 604.25 - 604.25 ditembus
Open chart in a new window


