

Pola sebenarnya

Bullish Rectangle
was formed on 31.03 at 05:26:24 (UTC+0)
signal strength 1 of 5
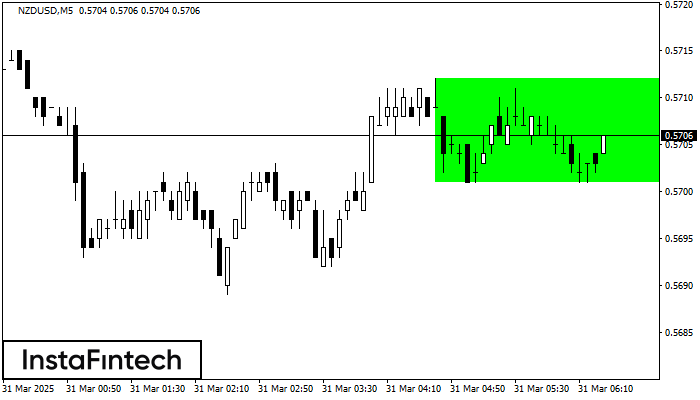
According to the chart of M5, NZDUSD formed the Bullish Rectangle. This type of a pattern indicates a trend continuation. It consists of two levels: resistance 0.5712 and support 0.5701. In case the resistance level 0.5712 - 0.5712 is broken, the instrument is likely to follow the bullish trend.
The M5 and M15 time frames may have more false entry points.
Lihat juga
- All
- All
- Bearish Rectangle
- Bearish Symmetrical Triangle
- Bearish Symmetrical Triangle
- Bullish Rectangle
- Double Top
- Double Top
- Triple Bottom
- Triple Bottom
- Triple Top
- Triple Top
- All
- All
- Buy
- Sale
- All
- 1
- 2
- 3
- 4
- 5
Double Bottom
was formed on 21.04 at 17:34:56 (UTC+0)
signal strength 1 of 5
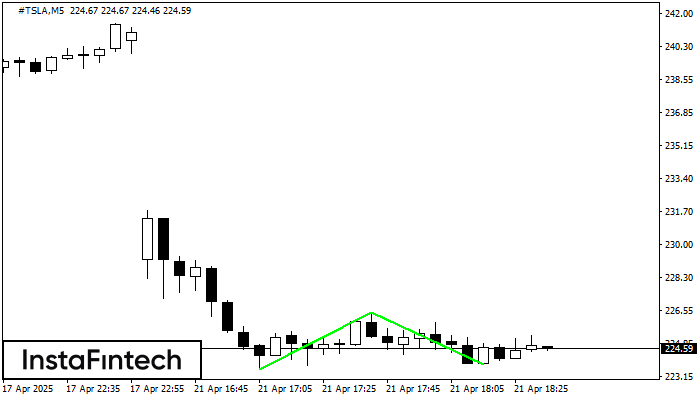
The Double Bottom pattern has been formed on #TSLA M5. This formation signals a reversal of the trend from downwards to upwards. The signal is that a buy trade should
The M5 and M15 time frames may have more false entry points.
Open chart in a new window
Double Bottom
was formed on 21.04 at 17:34:33 (UTC+0)
signal strength 1 of 5

The Double Bottom pattern has been formed on #TSLA M5; the upper boundary is 226.48; the lower boundary is 223.73. The width of the pattern is 301 points. In case
The M5 and M15 time frames may have more false entry points.
Open chart in a new window
Double Top
was formed on 21.04 at 17:30:06 (UTC+0)
signal strength 3 of 5
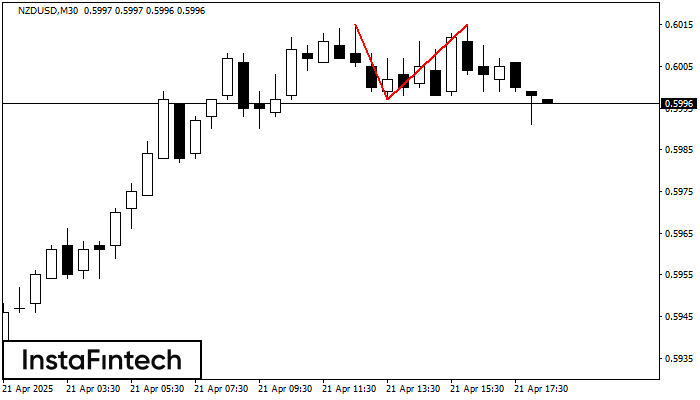
The Double Top pattern has been formed on NZDUSD M30. It signals that the trend has been changed from upwards to downwards. Probably, if the base of the pattern 0.5997
Open chart in a new window


