

Pola sebenarnya

Double Top
was formed on 31.03 at 04:40:34 (UTC+0)
signal strength 1 of 5
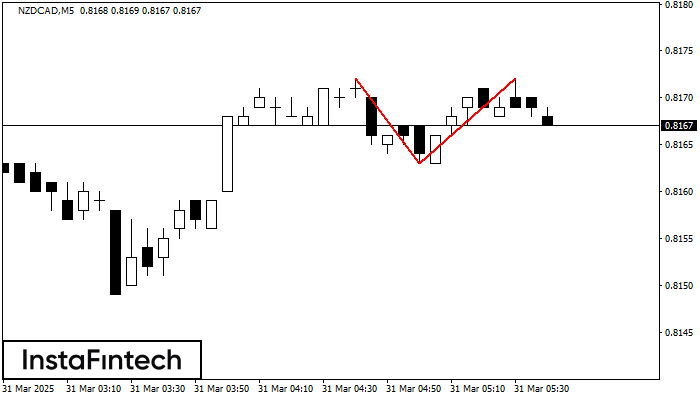
On the chart of NZDCAD M5 the Double Top reversal pattern has been formed. Characteristics: the upper boundary 0.8172; the lower boundary 0.8163; the width of the pattern 9 points. The signal: a break of the lower boundary will cause continuation of the downward trend targeting the 0.8148 level.
The M5 and M15 time frames may have more false entry points.
Lihat juga
- All
- All
- Bearish Rectangle
- Bearish Symmetrical Triangle
- Bearish Symmetrical Triangle
- Bullish Rectangle
- Double Top
- Double Top
- Triple Bottom
- Triple Bottom
- Triple Top
- Triple Top
- All
- All
- Buy
- Sale
- All
- 1
- 2
- 3
- 4
- 5
ডাবল টপ
was formed on 16.04 at 12:15:44 (UTC+0)
signal strength 1 of 5
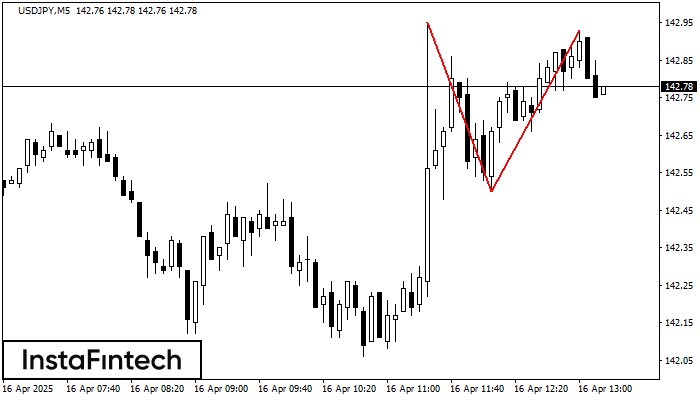
M5 চার্টে, USDJPY-এর ডাবল টপ রিভার্সাল বা বিপরীতমুখী প্যাটার্ন গঠিত হয়েছে। বৈশিষ্ট্য: উপরের সীমানা 142.93; নীচের সীমানা 142.50; প্যাটার্নের প্রস্থ 43 পয়েন্ট। সংকেত: নীচের সীমানা ব্রেক করা হলে 142.35 স্তরের
M5 এবং M15 টাইম ফ্রেমে আরও ভুল এন্ট্রি পয়েন্ট থাকতে পারে।
Open chart in a new window
বুলিশ সিমেট্রিকাল ট্রায়াঙ্গেল
was formed on 16.04 at 11:55:29 (UTC+0)
signal strength 1 of 5
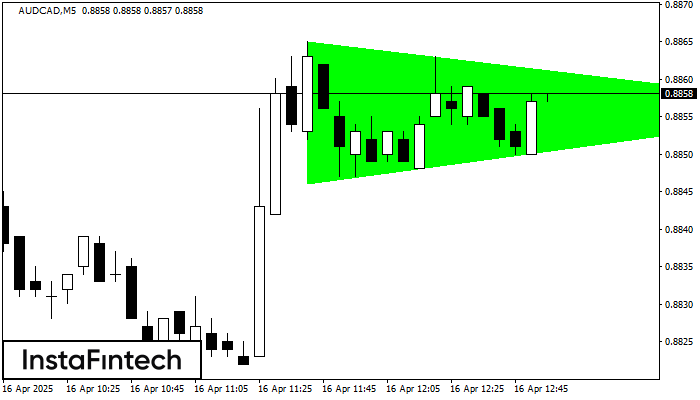
M5 চার্ট অনুসারে, AUDCAD বুলিশ সিমেট্রিকাল ট্রায়াঙ্গেল প্যাটার্ন গঠন করেছে, যা চলমান প্রবণতা অব্যাহত থাকবে বলে ইঙ্গিত দিচ্ছে। বর্ণনা: প্যাটার্নের উপরের সীমানা 0.8865/0.8856-এর কোঅর্ডিনেটগুলো স্পর্শ করেছে যেখানে নীচের সীমানা 0.8846/0.8856
M5 এবং M15 টাইম ফ্রেমে আরও ভুল এন্ট্রি পয়েন্ট থাকতে পারে।
Open chart in a new window
ডাবল বটম
was formed on 16.04 at 11:45:26 (UTC+0)
signal strength 1 of 5
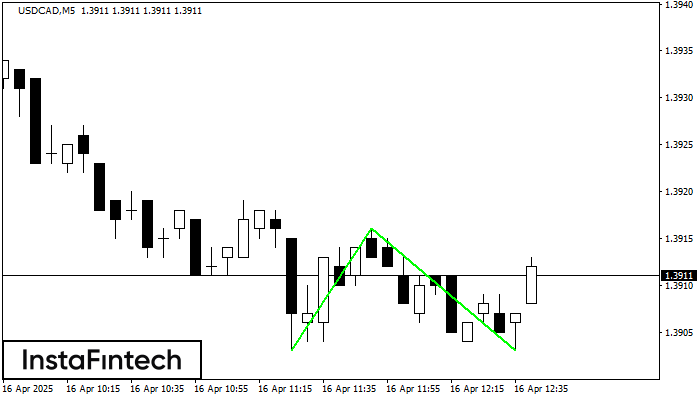
M5 চার্টে, USDCAD-এর ডাবল বটম প্যাটার্নটি গঠিত হয়েছে। উপরের সীমানা হল 1.3916; নীচের সীমানা হল 1.3903। প্যাটার্নের প্রস্থ হল 13 পয়েন্ট। 1.3916-এর উপরের সীমানা ভেদ করার ক্ষেত্রে, প্রবণতা পরিবর্তনের পূর্বাভাস
M5 এবং M15 টাইম ফ্রেমে আরও ভুল এন্ট্রি পয়েন্ট থাকতে পারে।
Open chart in a new window


