

Pola sebenarnya

Bearish Symmetrical Triangle
was formed on 31.03 at 03:35:35 (UTC+0)
signal strength 1 of 5
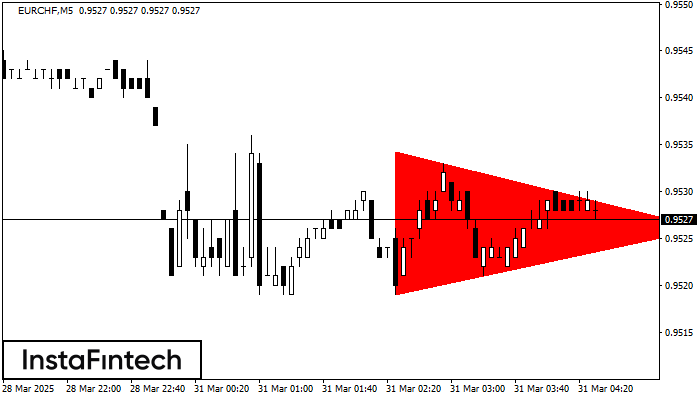
According to the chart of M5, EURCHF formed the Bearish Symmetrical Triangle pattern. Description: The lower border is 0.9519/0.9526 and upper border is 0.9534/0.9526. The pattern width is measured on the chart at -15 pips. The formation of the Bearish Symmetrical Triangle pattern evidently signals a continuation of the downward trend. In other words, if the scenario comes true and EURCHF breaches the lower border, the price could continue its move toward 0.9511.
The M5 and M15 time frames may have more false entry points.
Lihat juga
- All
- All
- Bearish Rectangle
- Bearish Symmetrical Triangle
- Bearish Symmetrical Triangle
- Bullish Rectangle
- Double Top
- Double Top
- Triple Bottom
- Triple Bottom
- Triple Top
- Triple Top
- All
- All
- Buy
- Sale
- All
- 1
- 2
- 3
- 4
- 5
Teratas Triple
was formed on 09.04 at 11:34:58 (UTC+0)
signal strength 1 of 5

Pada grafik instrumen trading NZDUSD M5, pola Teratas Triple yang menandakan perubahan trend telah terbentuk. Ada kemungkinan bahwa setelah pembentukan puncak (peak) ketiga, harga akan mencoba untuk menembus level resistance
Rangka waktu M5 dan M15 mungkin memiliki lebih dari titik entri yang keliru.
Open chart in a new window
Bawah Triple
was formed on 09.04 at 11:30:02 (UTC+0)
signal strength 3 of 5
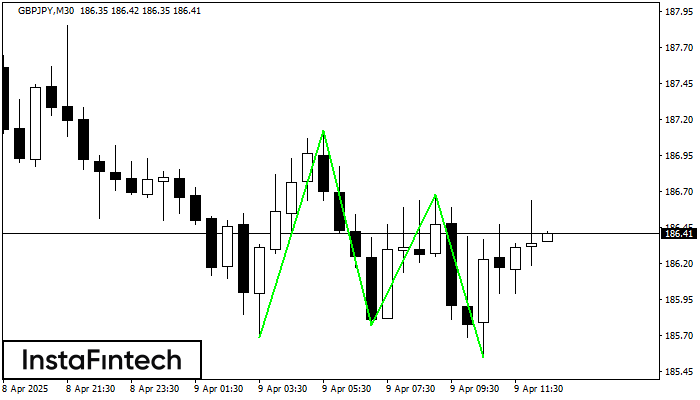
Pola Bawah Triple telah terbentuk pada grafik GBPJPY M30. Fitur-fitur pola: garis bawah pola memiliki koordinat 187.12 dengan batas atas 187.12/186.68, proyeksi lebar adalah 143 poin. Pembentukan pola Bawah Triple
Open chart in a new window
Persegi Bullish
was formed on 09.04 at 11:21:51 (UTC+0)
signal strength 1 of 5
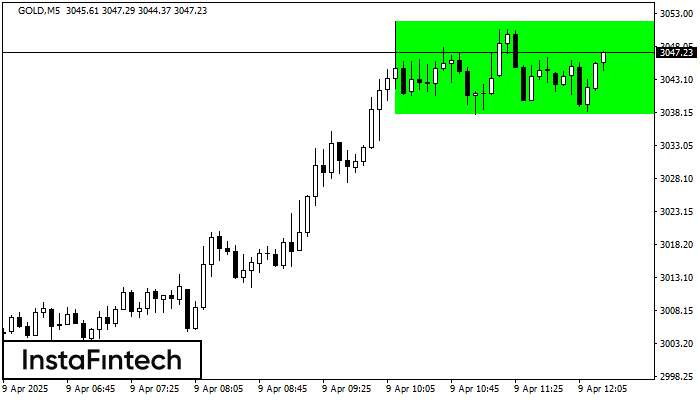
Menurut grafik dari M5, GOLD terbentuk Persegi Bullish. Jenis pola ini menunjukkan kelanjutan tren. Terdiri dari dua tingkat: resistance 3051.82 dan support 3037.74. Jika level resistance 3051.82 - 3051.82 ditembus
Rangka waktu M5 dan M15 mungkin memiliki lebih dari titik entri yang keliru.
Open chart in a new window


