

Pola sebenarnya

Bearish pennant
was formed on 31.03 at 01:15:38 (UTC+0)
signal strength 2 of 5

The Bearish pennant pattern has formed on the AUDUSD M15 chart. It signals potential continuation of the existing trend. Specifications: the pattern’s bottom has the coordinate of 0.6272; the projection of the flagpole height is equal to 19 pips. In case the price breaks out the pattern’s bottom of 0.6272, the downtrend is expected to continue for further level 0.6249.
The M5 and M15 time frames may have more false entry points.
Lihat juga
- All
- All
- Bearish Rectangle
- Bearish Symmetrical Triangle
- Bearish Symmetrical Triangle
- Bullish Rectangle
- Double Top
- Double Top
- Triple Bottom
- Triple Bottom
- Triple Top
- Triple Top
- All
- All
- Buy
- Sale
- All
- 1
- 2
- 3
- 4
- 5
Persegi Bullish
was formed on 10.04 at 04:34:35 (UTC+0)
signal strength 1 of 5
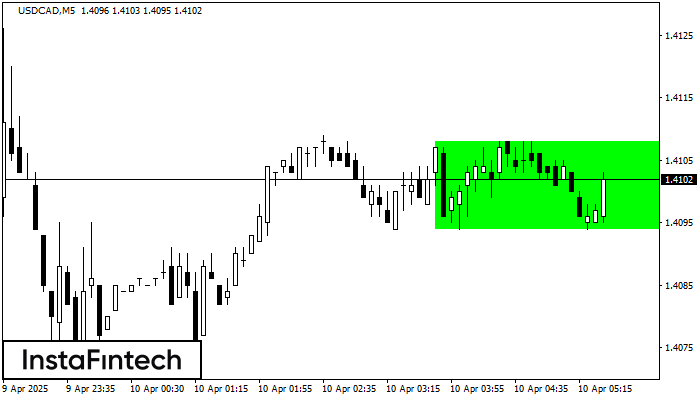
Menurut grafik dari M5, USDCAD terbentuk Persegi Bullish. Pola menunjukkan kelanjutan tren. Batas atas adalah 1.4108, batas lebih rendah adalah 1.4094. Sinyal berarti posisi beli harus dibuka diatas batas atas
Rangka waktu M5 dan M15 mungkin memiliki lebih dari titik entri yang keliru.
Open chart in a new window
Persegi Bullish
was formed on 10.04 at 04:30:30 (UTC+0)
signal strength 3 of 5
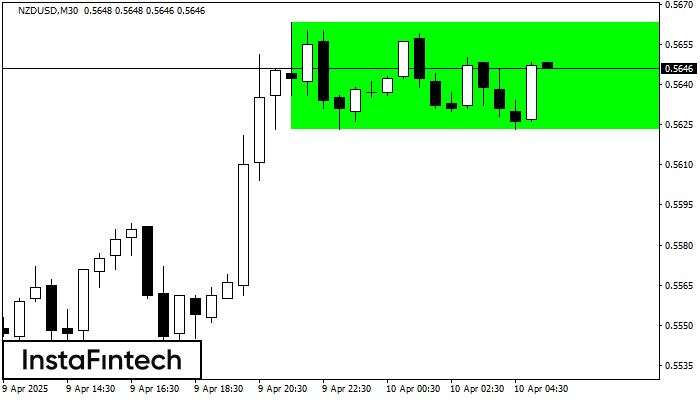
Menurut grafik dari M30, NZDUSD terbentuk Persegi Bullish. Pola menunjukkan kelanjutan tren. Batas atas adalah 0.5663, batas lebih rendah adalah 0.5623. Sinyal berarti posisi beli harus dibuka diatas batas atas
Open chart in a new window
Teratas Ganda
was formed on 10.04 at 04:00:21 (UTC+0)
signal strength 3 of 5
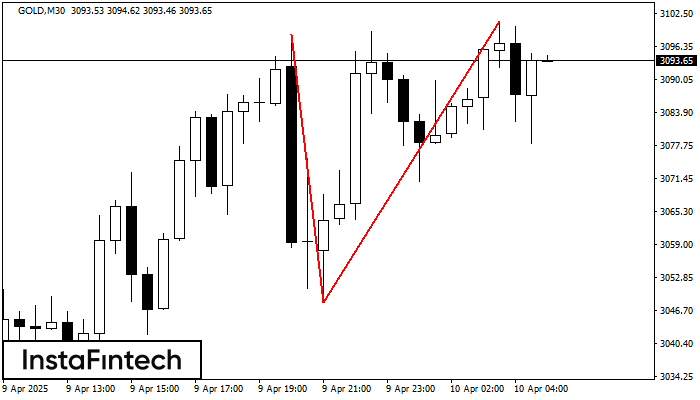
Pada grafik GOLD M30 pola reversal Teratas Ganda telah terbentuk. Karakteristik: batas atas 3100.96; batas bawah 3048.18; lebar pola 5278 poin. Sinyal: tembusan ke batas bawah akan menyebabkan kelanjutan tren
Open chart in a new window


