

Pola sebenarnya

Double Bottom
was formed on 31.03 at 00:50:23 (UTC+0)
signal strength 1 of 5
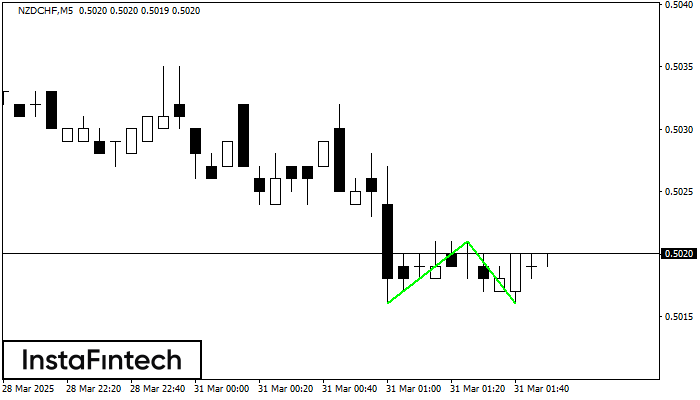
The Double Bottom pattern has been formed on NZDCHF M5; the upper boundary is 0.5021; the lower boundary is 0.5016. The width of the pattern is 5 points. In case of a break of the upper boundary 0.5021, a change in the trend can be predicted where the width of the pattern will coincide with the distance to a possible take profit level.
The M5 and M15 time frames may have more false entry points.
Lihat juga
- All
- All
- Bearish Rectangle
- Bearish Symmetrical Triangle
- Bearish Symmetrical Triangle
- Bullish Rectangle
- Double Top
- Double Top
- Triple Bottom
- Triple Bottom
- Triple Top
- Triple Top
- All
- All
- Buy
- Sale
- All
- 1
- 2
- 3
- 4
- 5
Bawah Ganda
was formed on 22.04 at 14:06:13 (UTC+0)
signal strength 1 of 5

Pola Bawah Ganda telah terbentuk pada NZDCHF M5; batas atas di 0.4874; batas bawah di 0.4857. Lebar pola sebesar 17 poin. Jika harga menembus batas atas 0.4874, Perubahan dalam tren
Rangka waktu M5 dan M15 mungkin memiliki lebih dari titik entri yang keliru.
Open chart in a new window
Bawah Ganda
was formed on 22.04 at 13:40:19 (UTC+0)
signal strength 1 of 5

Pola Bawah Ganda telah terbentuk pada GBPJPY M5. Karakteristik: level support 187.44; level resistance 187.65; lebar pola 21 poin. Jika level resistance ditembus, perubahan dalam tren dapat diprediksi dengan target
Rangka waktu M5 dan M15 mungkin memiliki lebih dari titik entri yang keliru.
Open chart in a new window
Bawah Ganda
was formed on 22.04 at 12:20:21 (UTC+0)
signal strength 1 of 5

Pola Bawah Ganda telah terbentuk pada AUDCHF M5. Formasi ini mensinyalkan reversal tren dari arah penurunan ke arah kenaikan. Sinyal menunjukkan bahwa transaksi beli harus dibuka setelah batas atas pola
Rangka waktu M5 dan M15 mungkin memiliki lebih dari titik entri yang keliru.
Open chart in a new window


