

Pola sebenarnya

Inverse Head and Shoulder
was formed on 29.03 at 22:00:17 (UTC+0)
signal strength 2 of 5

According to the chart of M15, #Bitcoin produced the pattern termed the Inverse Head and Shoulder. The Head is fixed at 81609.29 while the median line of the Neck is set at 82839.07/82640.15. The formation of the Inverse Head and Shoulder Pattern clearly indicates a reversal of the downward trend. In means that in case the scenario comes true, the price of #Bitcoin will go towards 82640.38.
The M5 and M15 time frames may have more false entry points.
- All
- All
- Bearish Rectangle
- Bearish Symmetrical Triangle
- Bearish Symmetrical Triangle
- Bullish Rectangle
- Double Top
- Double Top
- Triple Bottom
- Triple Bottom
- Triple Top
- Triple Top
- All
- All
- Buy
- Sale
- All
- 1
- 2
- 3
- 4
- 5
Bearish Rectangle
сформирован 04.05 в 23:37:44 (UTC+0)
сила сигнала 1 из 5

According to the chart of M5, EURUSD formed the Bearish Rectangle. This type of a pattern indicates a trend continuation. It consists of two levels: resistance 1.1308 - 0.0000
The M5 and M15 time frames may have more false entry points.
Открыть график инструмента в новом окне
Double Top
сформирован 04.05 в 23:30:43 (UTC+0)
сила сигнала 3 из 5
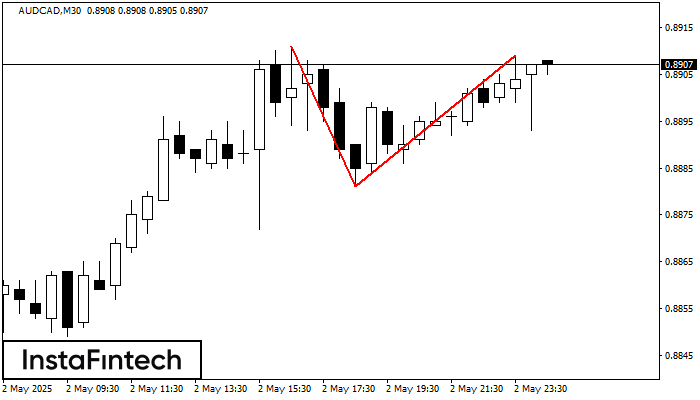
The Double Top pattern has been formed on AUDCAD M30. It signals that the trend has been changed from upwards to downwards. Probably, if the base of the pattern 0.8881
Открыть график инструмента в новом окне
Bearish Rectangle
сформирован 04.05 в 23:26:25 (UTC+0)
сила сигнала 2 из 5
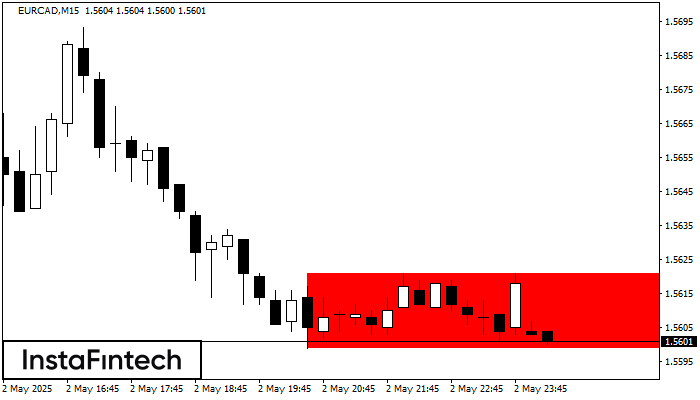
According to the chart of M15, EURCAD formed the Bearish Rectangle. This type of a pattern indicates a trend continuation. It consists of two levels: resistance 1.5621 - 0.0000
The M5 and M15 time frames may have more false entry points.
Открыть график инструмента в новом окне


