

Pola sebenarnya

Double Top
was formed on 29.03 at 20:55:27 (UTC+0)
signal strength 1 of 5
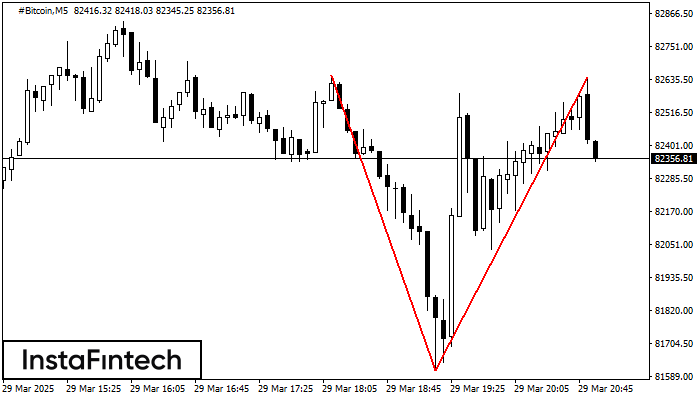
The Double Top reversal pattern has been formed on #Bitcoin M5. Characteristics: the upper boundary 82648.20; the lower boundary 81609.29; the width of the pattern is 103086 points. Sell trades are better to be opened below the lower boundary 81609.29 with a possible movements towards the 81609.14 level.
The M5 and M15 time frames may have more false entry points.
- All
- All
- Bearish Rectangle
- Bearish Symmetrical Triangle
- Bearish Symmetrical Triangle
- Bullish Rectangle
- Double Top
- Double Top
- Triple Bottom
- Triple Bottom
- Triple Top
- Triple Top
- All
- All
- Buy
- Sale
- All
- 1
- 2
- 3
- 4
- 5
Bullish Rectangle
was formed on 02.05 at 16:26:31 (UTC+0)
signal strength 1 of 5
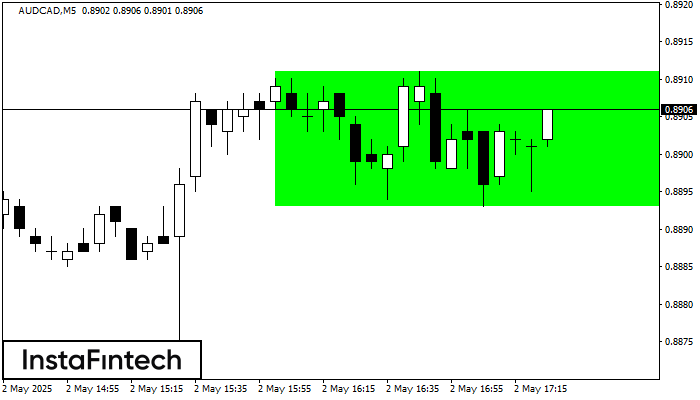
According to the chart of M5, AUDCAD formed the Bullish Rectangle. This type of a pattern indicates a trend continuation. It consists of two levels: resistance 0.8911 and support 0.8893
The M5 and M15 time frames may have more false entry points.
Open chart in a new window
Double Top
was formed on 02.05 at 16:05:28 (UTC+0)
signal strength 1 of 5
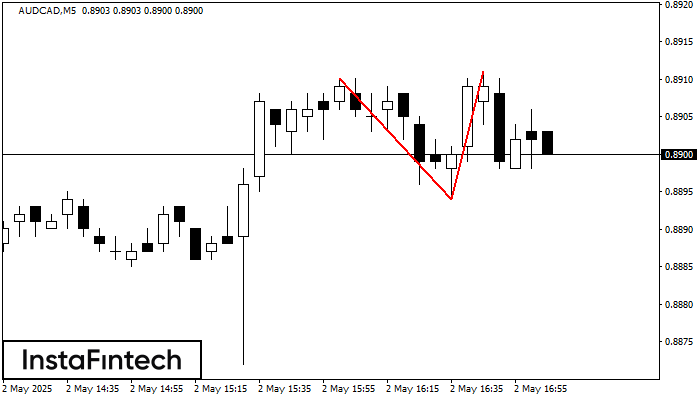
On the chart of AUDCAD M5 the Double Top reversal pattern has been formed. Characteristics: the upper boundary 0.8911; the lower boundary 0.8894; the width of the pattern 17 points
The M5 and M15 time frames may have more false entry points.
Open chart in a new window
Head and Shoulders
was formed on 02.05 at 15:40:20 (UTC+0)
signal strength 1 of 5
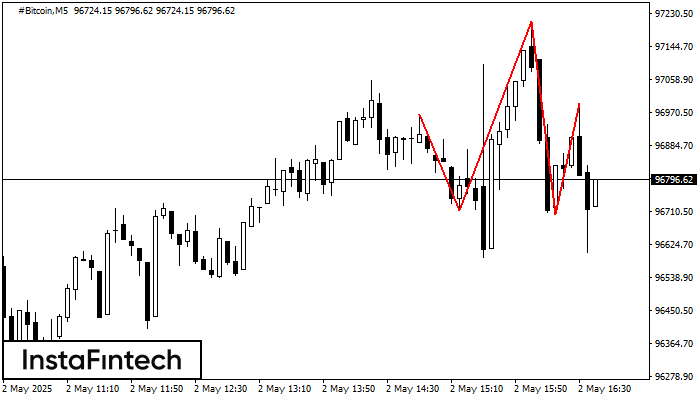
The technical pattern called Head and Shoulders has appeared on the chart of #Bitcoin M5. There are weighty reasons to suggest that the price will surpass the Neckline 96714.23/96704.41 after
The M5 and M15 time frames may have more false entry points.
Open chart in a new window


