

Pola sebenarnya

Triple Bottom
was formed on 28.03 at 20:05:30 (UTC+0)
signal strength 1 of 5
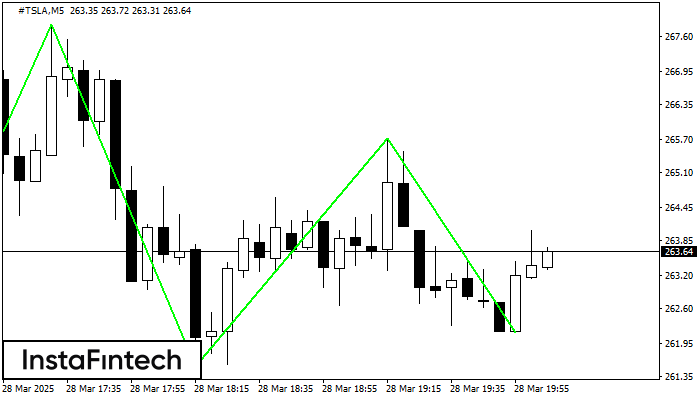
The Triple Bottom pattern has been formed on #TSLA M5. It has the following characteristics: resistance level 267.82/265.73; support level 260.65/262.15; the width is 717 points. In the event of a breakdown of the resistance level of 267.82, the price is likely to continue an upward movement at least to 261.68.
The M5 and M15 time frames may have more false entry points.
- All
- All
- Bearish Rectangle
- Bearish Symmetrical Triangle
- Bearish Symmetrical Triangle
- Bullish Rectangle
- Double Top
- Double Top
- Triple Bottom
- Triple Bottom
- Triple Top
- Triple Top
- All
- All
- Buy
- Sale
- All
- 1
- 2
- 3
- 4
- 5
Double Bottom
was formed on 22.04 at 05:55:18 (UTC+0)
signal strength 1 of 5
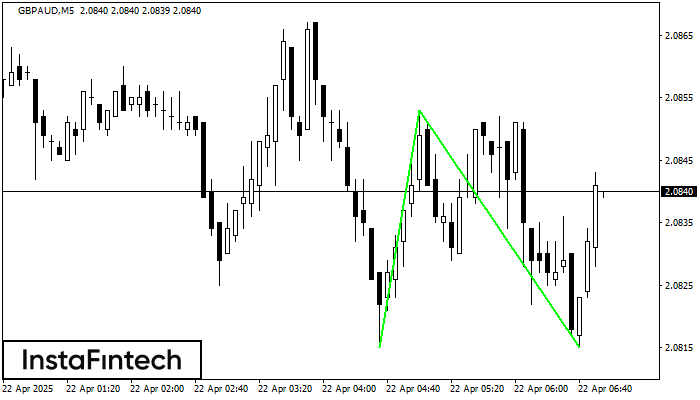
The Double Bottom pattern has been formed on GBPAUD M5. Characteristics: the support level 2.0815; the resistance level 2.0853; the width of the pattern 38 points. If the resistance level
The M5 and M15 time frames may have more false entry points.
Open chart in a new window
Double Top
was formed on 22.04 at 04:35:45 (UTC+0)
signal strength 1 of 5

The Double Top reversal pattern has been formed on NZDCHF M5. Characteristics: the upper boundary 0.4869; the lower boundary 0.4861; the width of the pattern is 7 points. Sell trades
The M5 and M15 time frames may have more false entry points.
Open chart in a new window
Bearish Flag
was formed on 22.04 at 04:22:30 (UTC+0)
signal strength 1 of 5

The Bearish Flag pattern has been formed on the chart SILVER M5. Therefore, the downwards trend is likely to continue in the nearest term. As soon as the price breaks
The M5 and M15 time frames may have more false entry points.
Open chart in a new window


