

Pola sebenarnya

Bearish Rectangle
was formed on 27.03 at 07:21:11 (UTC+0)
signal strength 1 of 5
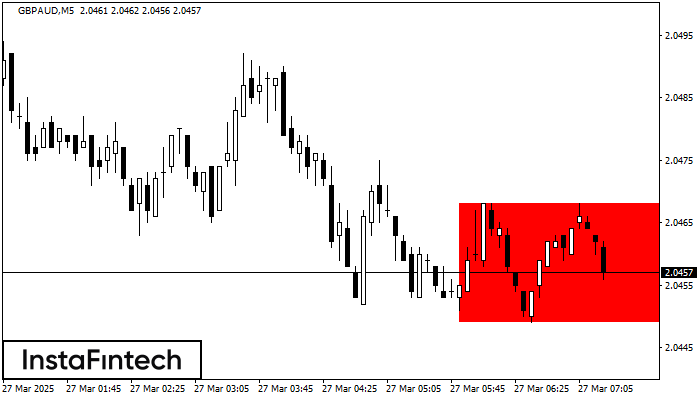
According to the chart of M5, GBPAUD formed the Bearish Rectangle. This type of a pattern indicates a trend continuation. It consists of two levels: resistance 2.0468 - 0.0000 and support 2.0449 – 2.0449. In case the resistance level 2.0449 - 2.0449 is broken, the instrument is likely to follow the bearish trend.
The M5 and M15 time frames may have more false entry points.
Lihat juga
- All
- All
- Bearish Rectangle
- Bearish Symmetrical Triangle
- Bearish Symmetrical Triangle
- Bullish Rectangle
- Double Top
- Double Top
- Triple Bottom
- Triple Bottom
- Triple Top
- Triple Top
- All
- All
- Buy
- Sale
- All
- 1
- 2
- 3
- 4
- 5
Bawah Ganda
was formed on 15.04 at 22:25:12 (UTC+0)
signal strength 1 of 5
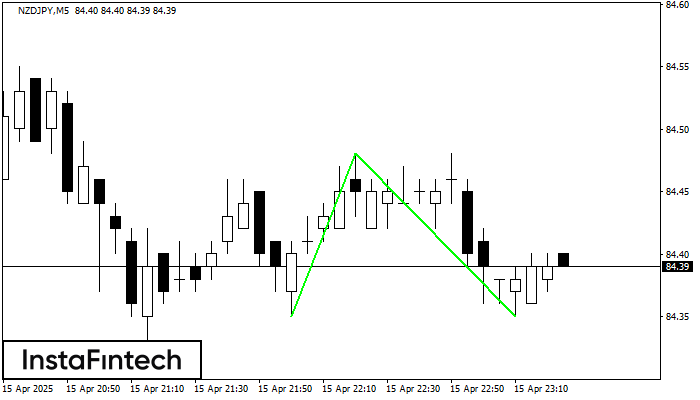
Pola Bawah Ganda telah terbentuk pada NZDJPY M5. Karakteristik: level support 84.35; level resistance 84.48; lebar pola 13 poin. Jika level resistance ditembus, perubahan dalam tren dapat diprediksi dengan target
Rangka waktu M5 dan M15 mungkin memiliki lebih dari titik entri yang keliru.
Open chart in a new window
Segitiga Simetris Bullish
was formed on 15.04 at 22:01:32 (UTC+0)
signal strength 3 of 5
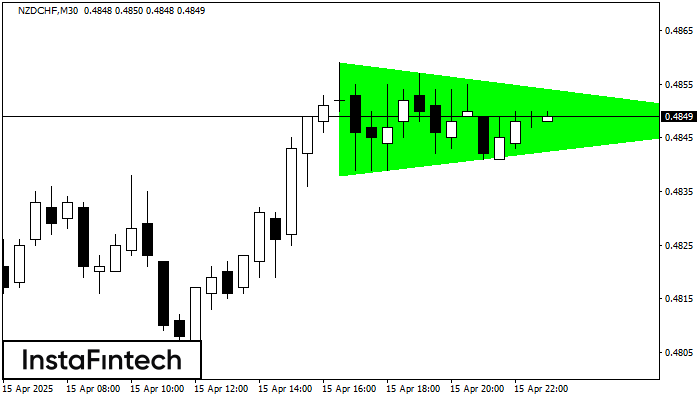
Menurut Grafik dari M30, NZDCHF dibentuk pola Segitiga Simetris Bullish. Batas yang lebih rendah dari pola menyentuh kordinat 0.4838/0.4848 dimana batas atas berada sepanjang 0.4859/0.4848. Jika pola Segitiga Simetris Bullish
Open chart in a new window
Persegi Bullish
was formed on 15.04 at 22:01:27 (UTC+0)
signal strength 3 of 5

Menurut grafik dari M30, NZDCHF terbentuk Persegi Bullish. Jenis pola ini menunjukkan kelanjutan tren. Terdiri dari dua tingkat: resistance 0.4859 dan support 0.4839. Jika level resistance 0.4859 - 0.4859 ditembus
Open chart in a new window


