

Pola sebenarnya

Bullish Rectangle
was formed on 26.03 at 14:44:13 (UTC+0)
signal strength 3 of 5
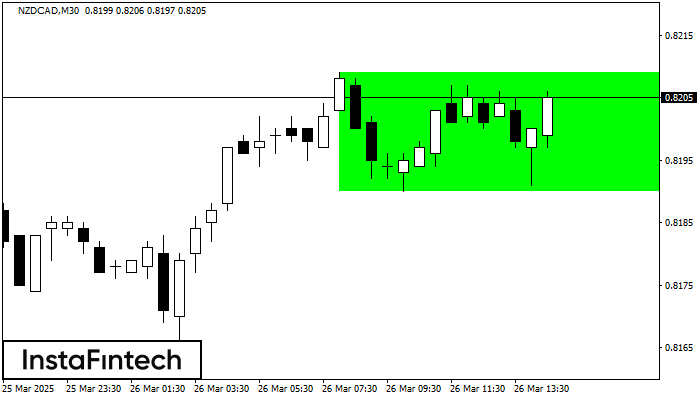
According to the chart of M30, NZDCAD formed the Bullish Rectangle which is a pattern of a trend continuation. The pattern is contained within the following borders: the lower border 0.8190 – 0.8190 and upper border 0.8209 – 0.8209. In case the upper border is broken, the instrument is likely to follow the upward trend.
Lihat juga
- All
- All
- Bearish Rectangle
- Bearish Symmetrical Triangle
- Bearish Symmetrical Triangle
- Bullish Rectangle
- Double Top
- Double Top
- Triple Bottom
- Triple Bottom
- Triple Top
- Triple Top
- All
- All
- Buy
- Sale
- All
- 1
- 2
- 3
- 4
- 5
Teratas Ganda
was formed on 09.04 at 08:30:11 (UTC+0)
signal strength 3 of 5
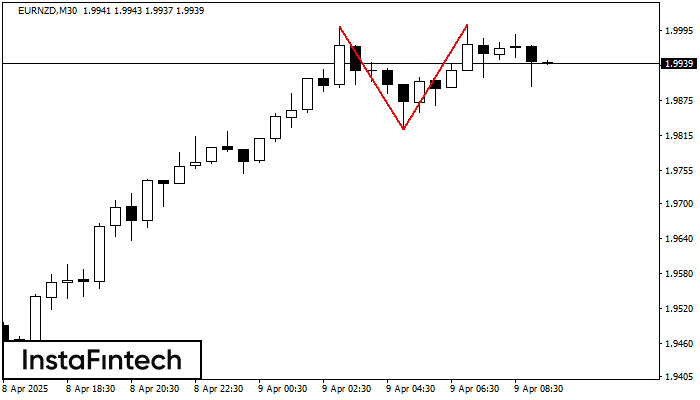
Pola Teratas Ganda telah terbentuk pada EURNZD M30. Pola ini menandakan bahwa tren telah berubah dari kenaikan menjadi penurunan. Mungkin, jika dasar pola di 1.9825 ditembus, maka pergerakan menurun akan
Open chart in a new window
Bawah Ganda
was formed on 09.04 at 08:30:03 (UTC+0)
signal strength 3 of 5
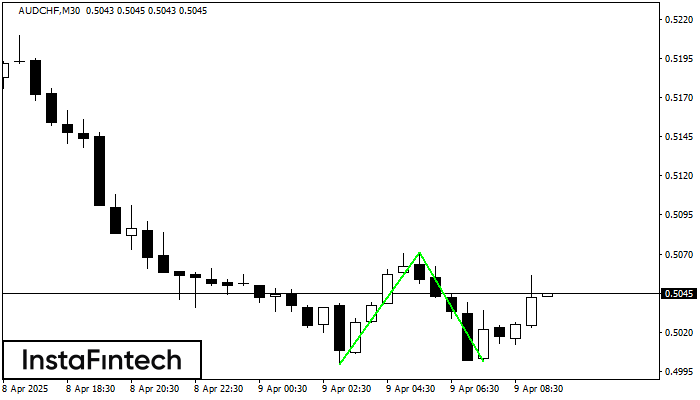
Pola Bawah Ganda telah terbentuk pada AUDCHF M30; batas atas di 0.5071; batas bawah di 0.5001. Lebar pola sebesar 72 poin. Jika harga menembus batas atas 0.5071, Perubahan dalam tren
Open chart in a new window
Teratas Ganda
was formed on 09.04 at 08:15:06 (UTC+0)
signal strength 2 of 5
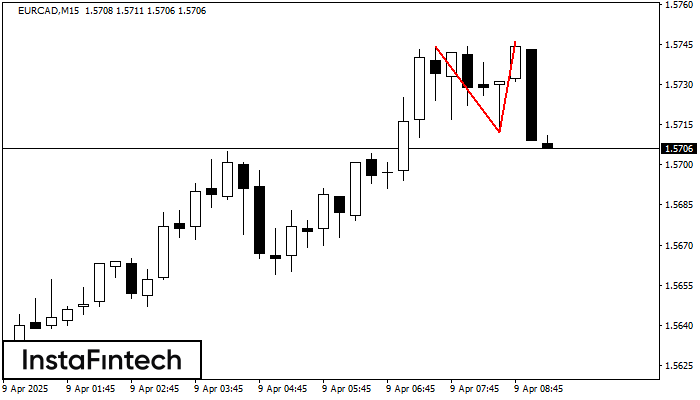
Pada grafik EURCAD M15 pola reversal Teratas Ganda telah terbentuk. Karakteristik: batas atas 1.5746; batas bawah 1.5712; lebar pola 34 poin. Sinyal: tembusan ke batas bawah akan menyebabkan kelanjutan tren
Rangka waktu M5 dan M15 mungkin memiliki lebih dari titik entri yang keliru.
Open chart in a new window


