

Pola sebenarnya

Triple Top
was formed on 26.03 at 14:05:08 (UTC+0)
signal strength 1 of 5
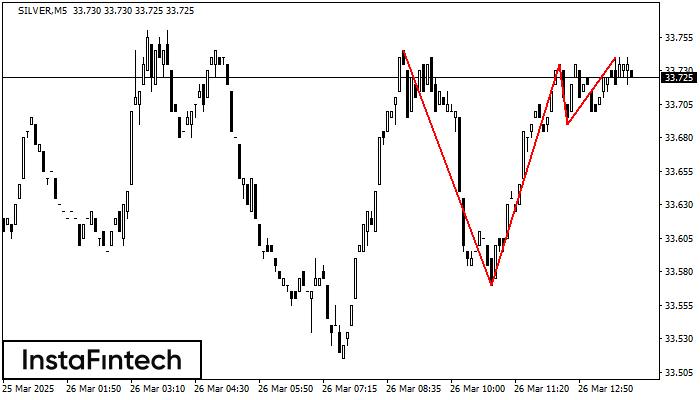
The Triple Top pattern has formed on the chart of the SILVER M5. Features of the pattern: borders have an ascending angle; the lower line of the pattern has the coordinates 33.57/33.69 with the upper limit 33.74/33.74; the projection of the width is 175 points. The formation of the Triple Top figure most likely indicates a change in the trend from upward to downward. This means that in the event of a breakdown of the support level of 33.57, the price is most likely to continue the downward movement.
The M5 and M15 time frames may have more false entry points.
Lihat juga
- All
- All
- Bearish Rectangle
- Bearish Symmetrical Triangle
- Bearish Symmetrical Triangle
- Bullish Rectangle
- Double Top
- Double Top
- Triple Bottom
- Triple Bottom
- Triple Top
- Triple Top
- All
- All
- Buy
- Sale
- All
- 1
- 2
- 3
- 4
- 5
Triple Bottom
was formed on 05.05 at 16:46:05 (UTC+0)
signal strength 2 of 5
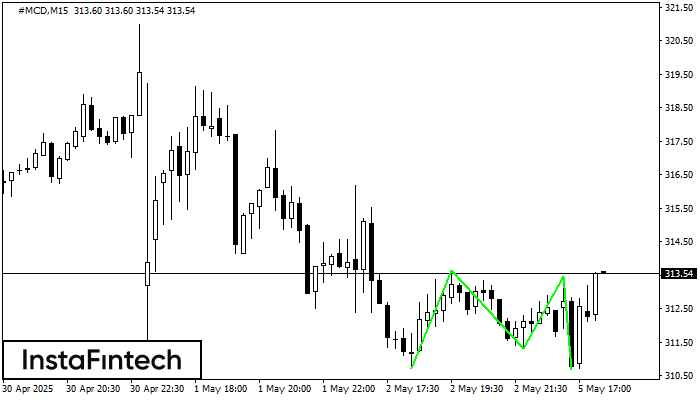
Corak Triple Bottom telah dibentuk pada carta bagi instrumen dagangan #MCD M15. Corak menandakan perubahan aliran dari menurun ke aliran menaik dalam sekiranya penembusan 313.64/313.45
Carta masa M5 dan M15 mungkin mempunyai lebih banyak titik kemasukan palsu.
Open chart in a new window
Triple Top
was formed on 05.05 at 16:29:57 (UTC+0)
signal strength 4 of 5
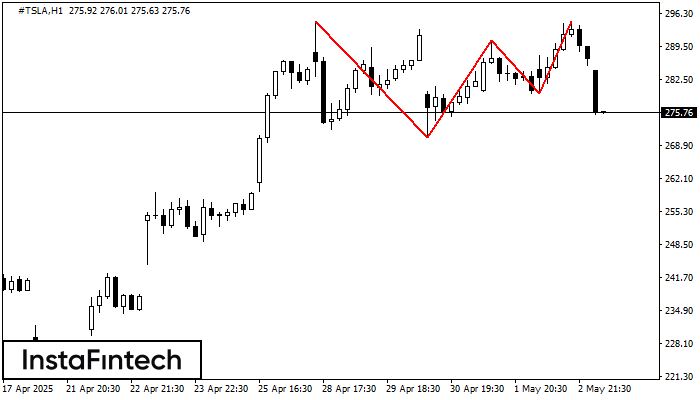
Corak Triple Top telah dibentuk pada carta #TSLA H1. Ciri corak: sempadan mempunyai sudut menaik; garisan bawah corak mempunyai koordinat 270.55/279.63 dengan had atas 294.59/294.52; unjuran lebar ialah 2404 mata
Open chart in a new window
Triple Top
was formed on 05.05 at 16:29:44 (UTC+0)
signal strength 4 of 5

Corak Triple Top telah dibentuk pada carta #TSLA H1. Ciri corak: sempadan mempunyai sudut menaik; garisan bawah corak mempunyai koordinat 270.55/279.63 dengan had atas 294.59/294.52; unjuran lebar ialah 2404 mata
Open chart in a new window


