

Pola sebenarnya

Bullish Symmetrical Triangle
was formed on 25.03 at 00:35:30 (UTC+0)
signal strength 2 of 5
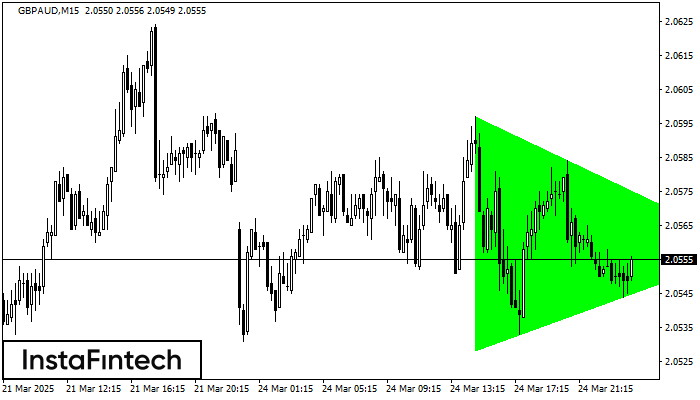
According to the chart of M15, GBPAUD formed the Bullish Symmetrical Triangle pattern. Description: This is the pattern of a trend continuation. 2.0597 and 2.0528 are the coordinates of the upper and lower borders respectively. The pattern width is measured on the chart at 69 pips. Outlook: If the upper border 2.0597 is broken, the price is likely to continue its move by 2.0580.
The M5 and M15 time frames may have more false entry points.
- All
- All
- Bearish Rectangle
- Bearish Symmetrical Triangle
- Bearish Symmetrical Triangle
- Bullish Rectangle
- Double Top
- Double Top
- Triple Bottom
- Triple Bottom
- Triple Top
- Triple Top
- All
- All
- Buy
- Sale
- All
- 1
- 2
- 3
- 4
- 5
Bearish Symmetrical Triangle
was formed on 05.05 at 11:17:27 (UTC+0)
signal strength 3 of 5
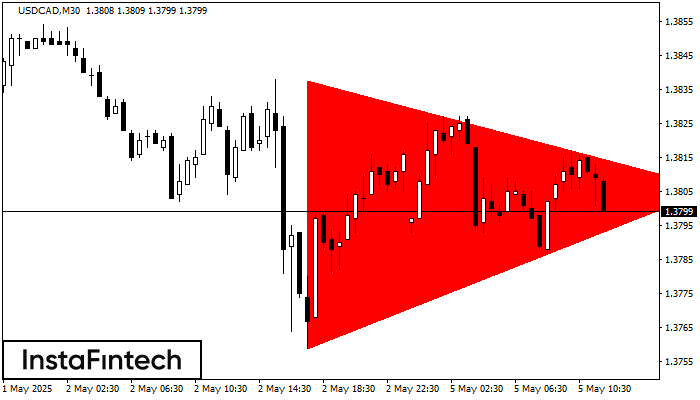
According to the chart of M30, USDCAD formed the Bearish Symmetrical Triangle pattern. Trading recommendations: A breach of the lower border 1.3759 is likely to encourage a continuation
Open chart in a new window
Triple Top
was formed on 05.05 at 10:59:43 (UTC+0)
signal strength 4 of 5
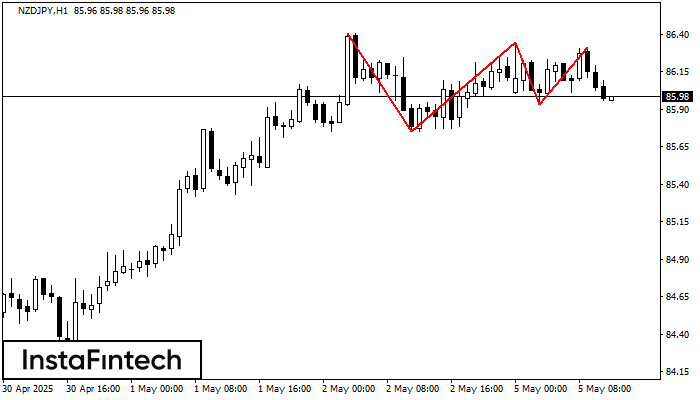
The Triple Top pattern has formed on the chart of the NZDJPY H1. Features of the pattern: borders have an ascending angle; the lower line of the pattern
Open chart in a new window
Bullish Rectangle
was formed on 05.05 at 10:31:43 (UTC+0)
signal strength 1 of 5
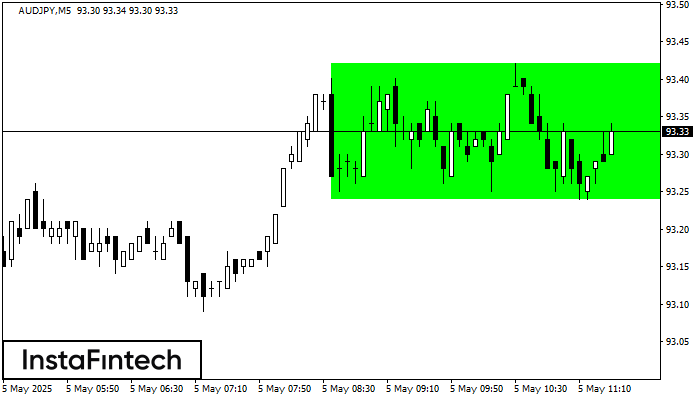
According to the chart of M5, AUDJPY formed the Bullish Rectangle. The pattern indicates a trend continuation. The upper border is 93.42, the lower border is 93.24. The signal means
The M5 and M15 time frames may have more false entry points.
Open chart in a new window


