

Pola sebenarnya

Bearish pennant
was formed on 24.03 at 01:00:40 (UTC+0)
signal strength 1 of 5
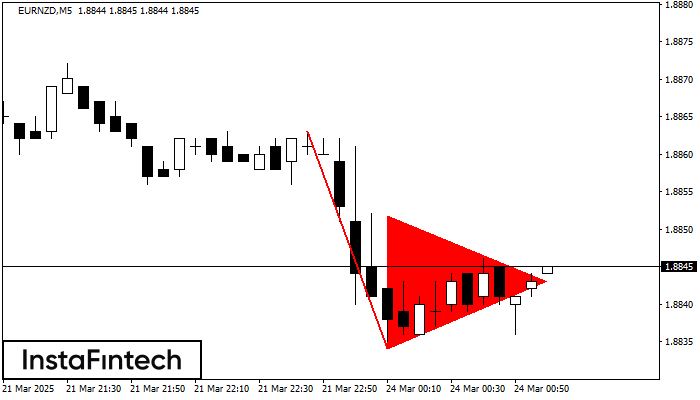
The Bearish pennant pattern has formed on the EURNZD M5 chart. It signals potential continuation of the existing trend. Specifications: the pattern’s bottom has the coordinate of 1.8834; the projection of the flagpole height is equal to 29 pips. In case the price breaks out the pattern’s bottom of 1.8834, the downtrend is expected to continue for further level 1.8819.
The M5 and M15 time frames may have more false entry points.
- All
- All
- Bearish Rectangle
- Bearish Symmetrical Triangle
- Bearish Symmetrical Triangle
- Bullish Rectangle
- Double Top
- Double Top
- Triple Bottom
- Triple Bottom
- Triple Top
- Triple Top
- All
- All
- Buy
- Sale
- All
- 1
- 2
- 3
- 4
- 5
Тройное дно
сформирован 02.05 в 22:50:22 (UTC+0)
сила сигнала 1 из 5

По торговому инструменту EURGBP на M5 была сформирована графическая фигура «Тройное дно» с характеристиками: Уровень сопротивления 0.8514; Уровень поддержки 0.8509; Ширина 5 пунктов. В случае пробоя уровня сопротивления 0.8515 котировка
Таймфреймы М5 и М15 могут иметь больше ложных точек входа.
Открыть график инструмента в новом окне
Двойная вершина
сформирован 02.05 в 21:50:15 (UTC+0)
сила сигнала 1 из 5

По USDJPY на M5 сформировалась разворотная фигура «Двойная вершина». Характеристика: Верхняя граница 145.09; Нижняя граница 144.90; Ширина фигуры 18 пунктов. Позицию на продажу возможно открыть ниже нижней границы 144.90
Таймфреймы М5 и М15 могут иметь больше ложных точек входа.
Открыть график инструмента в новом окне
Тройное дно
сформирован 02.05 в 21:45:21 (UTC+0)
сила сигнала 1 из 5

По торговому инструменту EURGBP на M5 была сформирована графическая фигура «Тройное дно» с характеристиками: Уровень сопротивления 0.8514; Уровень поддержки 0.8509; Ширина 5 пунктов. В случае пробоя уровня сопротивления 0.8515 котировка
Таймфреймы М5 и М15 могут иметь больше ложных точек входа.
Открыть график инструмента в новом окне


