

Pola sebenarnya

Inverse Head and Shoulder
was formed on 21.03 at 03:45:24 (UTC+0)
signal strength 1 of 5
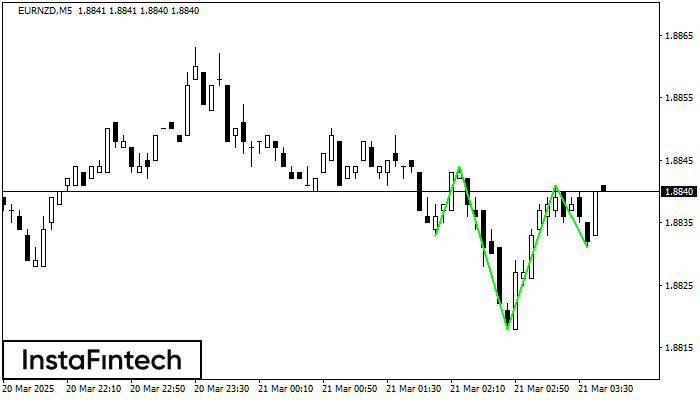
According to the chart of M5, EURNZD formed the Inverse Head and Shoulder pattern. The Head’s top is set at 1.8841 while the median line of the Neck is found at 1.8818/1.8831. The formation of the Inverse Head and Shoulder pattern evidently signals a reversal of the downward trend. In other words, in case the scenario comes true, the price of EURNZD will go towards 1.8856
The M5 and M15 time frames may have more false entry points.
Lihat juga
- All
- All
- Bearish Rectangle
- Bearish Symmetrical Triangle
- Bearish Symmetrical Triangle
- Bullish Rectangle
- Double Top
- Double Top
- Triple Bottom
- Triple Bottom
- Triple Top
- Triple Top
- All
- All
- Buy
- Sale
- All
- 1
- 2
- 3
- 4
- 5
Segitiga Simetris Bearish
was formed on 04.05 at 09:04:31 (UTC+0)
signal strength 2 of 5

Menurut Grafik dari M15, #Bitcoin dibentuk pola Segitiga Simetris Bearish. Rekomendasi Trading: Penembusan dari batas yang lebih rendah 95528.76 kemungkinan akan mendorong kelanjutan dari tren penurunan
Rangka waktu M5 dan M15 mungkin memiliki lebih dari titik entri yang keliru.
Open chart in a new window
Persegi Bearish
was formed on 04.05 at 00:51:55 (UTC+0)
signal strength 3 of 5

Menurut grafik dari M30, #Bitcoin terbentuk Persegi Bearish. Jenis pola ini menunjukkan kelanjutan tren. Terdiri dari dua tingkat: resistance 96456.78 - 0.00 dan support 95805.26 – 95805.26. Jika level resistance
Open chart in a new window
Bawah Ganda
was formed on 03.05 at 10:45:44 (UTC+0)
signal strength 2 of 5

Pola Bawah Ganda telah terbentuk pada #Bitcoin M15. Formasi ini mensinyalkan reversal tren dari arah penurunan ke arah kenaikan. Sinyal menunjukkan bahwa transaksi beli harus dibuka setelah batas atas pola
Rangka waktu M5 dan M15 mungkin memiliki lebih dari titik entri yang keliru.
Open chart in a new window


