Lihat juga


 03.04.2025 01:07 AM
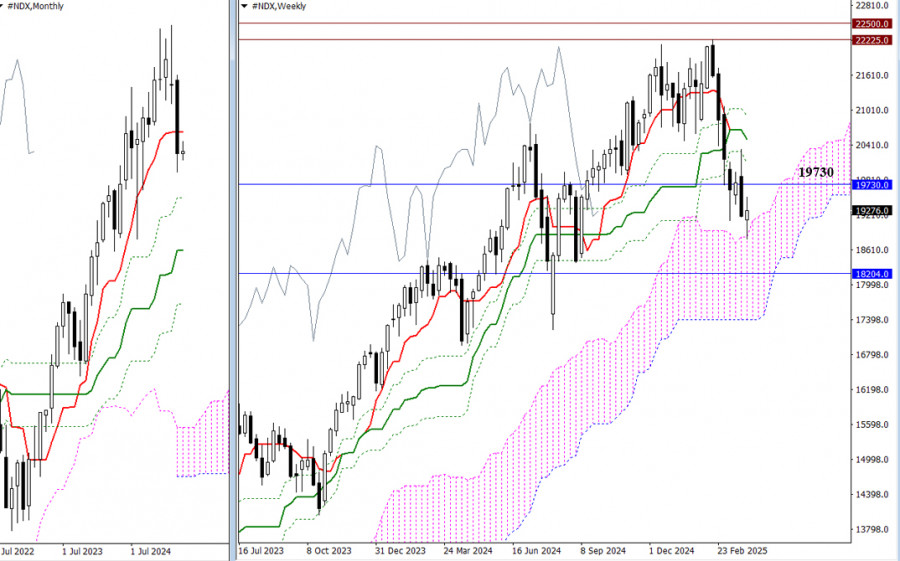
March concluded with a bearish candle that left a notable mark in the history books. Bears closed below the monthly short-term trend level (19,730) and eliminated the weekly golden cross, testing support at the upper boundary of the weekly Ichimoku cloud (18,821). If the decline continues, bearish targets will include testing and breaking through the next monthly support level (18,204) and exiting the weekly cloud (17,408). Should the bulls regain control by reclaiming the monthly short-term trend (19,730), they will aim to retest the levels of the weekly Ichimoku cross (20,103 – 20,508 – 20,914). Consolidation above these resistance levels will open the door for testing and updating the all-time high (22,225).
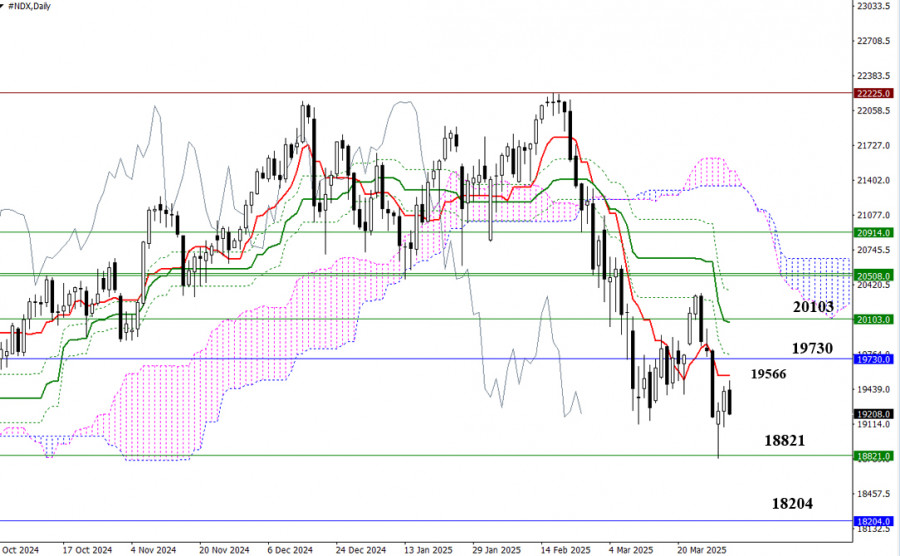
There is currently a downtrend occurring on the daily timeframe, but a corrective move has emerged and aims to test the first key level of the daily correction, which today lies at 19,566 (Tenkan-sen). Additional resistance levels are located at 19,730 – 19,765 – 20,065 – 20,103. A completed corrective climb followed by a drop below the corrective zone (18,792) will confirm a consolidation within the weekly cloud (18,821). The next downward target will be the monthly support at 18,204.
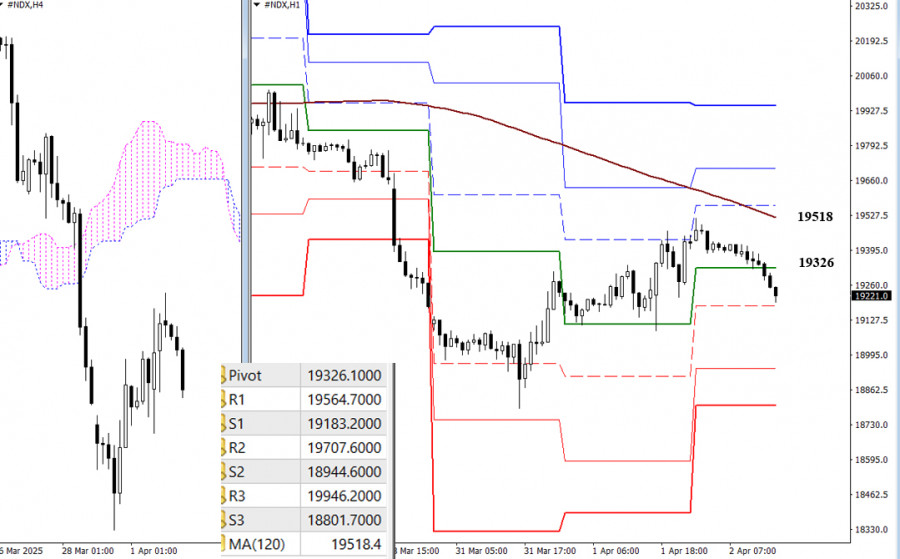
In the lower timeframes, the market is also in the corrective zone, and the main boundary on the way of bulls is the weekly long-term trend (19518). The breakdown and reversal of the trend will allow us to consider new upward benchmarks. The resistance of the classic Pivot levels (19565 - 19708 - 19946) will become these intraday targets. Completing the corrective rise and descent through the support of classic Pivot levels (19183 - 19945 - 18802) will allow an update on the minimum extreme of March (18792) and restore the downtrend.
***
You have already liked this post today
*Analisis pasar yang diposting disini dimaksudkan untuk meningkatkan pengetahuan Anda namun tidak untuk memberi instruksi trading.
Dari apa yang nampak di chart hariannya, pasangan mata uang Eksotik USD/IDR nampak muncul pola Bearish 123 yang diikuti oleh munculnya 2 Bearish Ross Hook (RH) dimana ini memberi petunjuk
Bila Kita perhatikan chart 4 jamnya indeks Nasdaq 100 yang bergerak diatas WMA (21) yang memiliki kemiringan menukik keatas, memberi petunjuk kalau saat ini Buyers masih cukup dominan sehingga dalam
Euro diperkirakan akan terus turun dalam beberapa jam ke depan. Oleh karena itu, kita harus mengantisipasi penutupan di bawah 1,1186 pada grafik H4. Kemudian, harga mungkin turun ke 1,1080
Di awal sesi Amerika, XAU/USD diperdagangkan di sekitar 3.180, naik setelah mencapai 3.175, level yang bertepatan dengan level support harian 3 (S_3). Rebound teknikal diharapkan terjadi dalam beberapa
Harga minyak mentah AS West Texas Intermediate (WTI) sedang berkonsolidasi mendekati level tertinggi satu bulan, menghentikan tren kenaikan selama empat hari, meskipun penurunan intraday tidak menunjukkan keyakinan bearish yang kuat
Ferrari F8 TRIBUTO
dari InstaTrade
InstaTrade dalam angka

Your IP address shows that you are currently located in the USA. If you are a resident of the United States, you are prohibited from using the services of InstaFintech Group including online trading, online transfers, deposit/withdrawal of funds, etc.
If you think you are seeing this message by mistake and your location is not the US, kindly proceed to the website. Otherwise, you must leave the website in order to comply with government restrictions.
Why does your IP address show your location as the USA?
Please confirm whether you are a US resident or not by clicking the relevant button below. If you choose the wrong option, being a US resident, you will not be able to open an account with InstaTrade anyway.
We are sorry for any inconvenience caused by this message.


