Lihat juga


 31.08.2023 06:42 PM
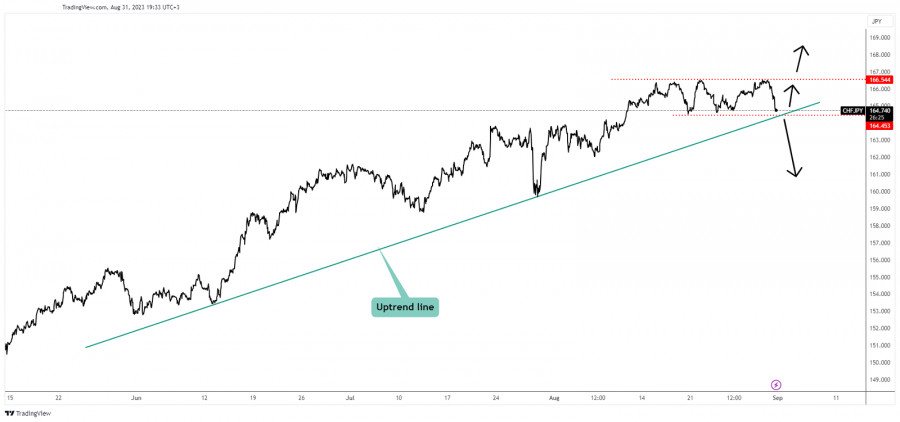
The CHF/JPY pair moves sideways in the short term. It's trapped between 166.54 and 164.45 levels. It's trading at 164.73 at the time of writing. As you can see on the H1 chart, the rate is almost to reach the uptrend line and the 164.45. Technically, these lines represent downside obstacles.
As long as it stays above these levels, the currency pair could resume its growth, it could extend the uptrend line.
Staying above the uptrend line may announce a new upwards movement at least towards the 166.54 former high. A larger growth could be activated after the rate jumps above this obstacle.
On the other hand, dropping below the uptrend line and under 164.45 is seen as a selling opportunity as the rate could develop a downside reversal.
You have already liked this post today
*Analisis pasar yang diposting disini dimaksudkan untuk meningkatkan pengetahuan Anda namun tidak untuk memberi instruksi trading.
Grafik XAU/USD (Gold/US Dollar) menunjukkan momentum bullish, yang mengisyaratkan tren kenaikan. Harga berpotensi melanjutkan kenaikan menuju level resistance pertama. Terdapat dua level support, dengan support pertama di 1952,65 sebagai overlap
Grafik GBP/USD saat ini menunjukkan momentum bearish, menunjukkan tren turun. Terdapat kemungkinan untuk harga melanjutkan pergerakan bearishnya, menargetkan level support pertama. Support pertama di 1,2245 merupakan level signifikan, bertindak sebagai
Pasangan XAU/USD saat ini menunjukkan kecenderungan bearish. Level support utama diidentifikasi pada 1932,03 dan 1913,98, keduanya merupakan level support overlap dan titik historis aktivitas pembelian. Hal ini dapat memperlambat atau
Your IP address shows that you are currently located in the USA. If you are a resident of the United States, you are prohibited from using the services of InstaFintech Group including online trading, online transfers, deposit/withdrawal of funds, etc.
If you think you are seeing this message by mistake and your location is not the US, kindly proceed to the website. Otherwise, you must leave the website in order to comply with government restrictions.
Why does your IP address show your location as the USA?
Please confirm whether you are a US resident or not by clicking the relevant button below. If you choose the wrong option, being a US resident, you will not be able to open an account with InstaTrade anyway.
We are sorry for any inconvenience caused by this message.

