

Actual patterns

Patterns are graphical models which are formed in the chart by the price. According to one of the technical analysis postulates, history (price movement) repeats itself. It means that the price movements are often similar in the same situations which makes it possible to predict the further development of the situation with a high probability.
Relevant patterns by InstaTrade is an easy-to-use service which allows you to be aware of latest changes in the market and react to clues from the market in time. In our service you will always find the latest and most relevant patterns on any pair and any timeframe.
Bearish pennant
was formed on 07.04 at 00:45:25 (UTC+0)
signal strength 2 of 5
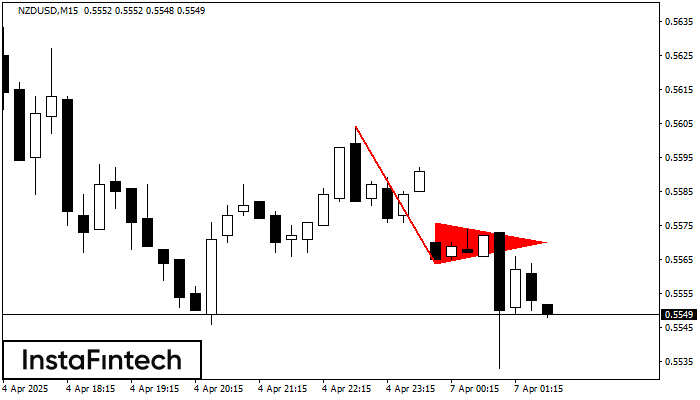
The Bearish pennant pattern has formed on the NZDUSD M15 chart. It signals potential continuation of the existing trend. Specifications: the pattern’s bottom has the coordinate of 0.5564; the projection of the flagpole height is equal to 40 pips. In case the price breaks out the pattern’s bottom of 0.5564, the downtrend is expected to continue for further level 0.5541.
The M5 and M15 time frames may have more false entry points.
- All
- All
- Bearish Rectangle
- Bearish Symmetrical Triangle
- Bearish Symmetrical Triangle
- Bullish Rectangle
- Double Top
- Double Top
- Triple Bottom
- Triple Bottom
- Triple Top
- Triple Top
- All
- All
- Buy
- Sale
- All
- 1
- 2
- 3
- 4
- 5
Double Bottom
was formed on 09.05 at 11:50:02 (UTC+0)
signal strength 1 of 5
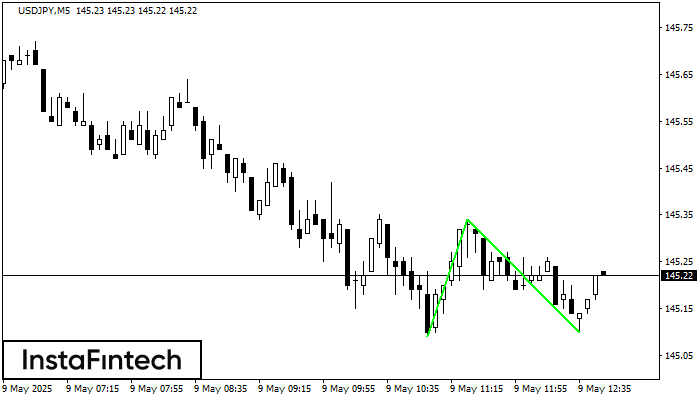
Corak Double Bottom telah dibentuk pada USDJPY M5. Pembentukan ini menandakan pembalikan aliran dari aliran menurun ke atas. Isyarat ialah perdagangan membeli harus dibuka selepas sempadan atas corak 145.34 telah
Carta masa M5 dan M15 mungkin mempunyai lebih banyak titik kemasukan palsu.
Open chart in a new window
Double Top
was formed on 09.05 at 11:00:06 (UTC+0)
signal strength 3 of 5
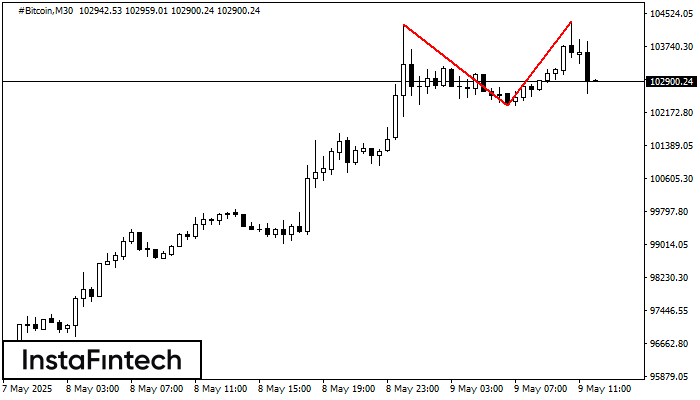
Corak Double Top telah dibentuk pada #Bitcoin M30. Isyarat bahawa aliran telah berubah dari aliran menaik ke aliran menurun. Mungkin, sekiranya asas corak 102332.80 ditembusi, pergerakan menurun akan berterusan
Open chart in a new window
Double Top
was formed on 09.05 at 10:44:55 (UTC+0)
signal strength 2 of 5
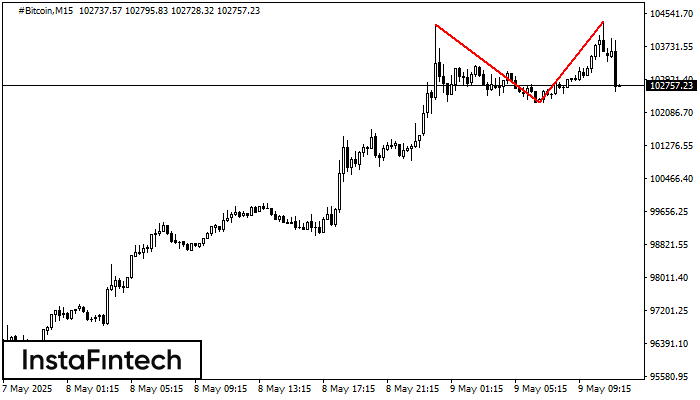
Corak pembalikan Double Top telah dibentuk pada #Bitcoin M15. Ciri-ciri: sempadan atas %P0.000000; sempadan bawah 104269.79; sempadan bawah 102332.80; lebar corak adalah 201342 mata. Dagangan menjual adalah lebih baik untuk
Carta masa M5 dan M15 mungkin mempunyai lebih banyak titik kemasukan palsu.
Open chart in a new window


