

Actual patterns

Patterns are graphical models which are formed in the chart by the price. According to one of the technical analysis postulates, history (price movement) repeats itself. It means that the price movements are often similar in the same situations which makes it possible to predict the further development of the situation with a high probability.
Relevant patterns by InstaTrade is an easy-to-use service which allows you to be aware of latest changes in the market and react to clues from the market in time. In our service you will always find the latest and most relevant patterns on any pair and any timeframe.
Double Top
was formed on 26.03 at 10:30:57 (UTC+0)
signal strength 3 of 5
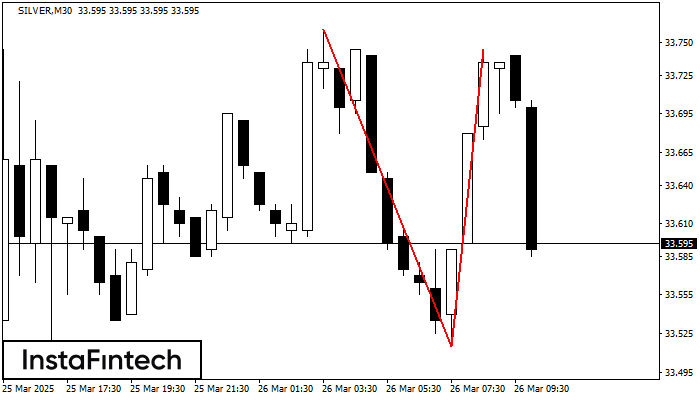
On the chart of SILVER M30 the Double Top reversal pattern has been formed. Characteristics: the upper boundary 33.74; the lower boundary 33.52; the width of the pattern 230 points. The signal: a break of the lower boundary will cause continuation of the downward trend targeting the 33.48 level.
See Also
- All
- All
- Bearish Rectangle
- Bearish Symmetrical Triangle
- Bearish Symmetrical Triangle
- Bullish Rectangle
- Double Top
- Double Top
- Triple Bottom
- Triple Bottom
- Triple Top
- Triple Top
- All
- All
- Buy
- Sale
- All
- 1
- 2
- 3
- 4
- 5
Hình chữ nhật tăng
was formed on 09.05 at 22:57:29 (UTC+0)
signal strength 1 of 5

Theo biểu đồ của M5, GBPJPY đã tạo thành Hình chữ nhật tăng. Mô hình này cho thấy một sự tiếp tục xu hướng. Đường viền trên là 193.44, đường
Khung thời gian M5 và M15 có thể có nhiều điểm vào lệnh sai hơn.
Open chart in a new window
Đáy ba
was formed on 09.05 at 22:35:52 (UTC+0)
signal strength 1 of 5

Mô hình Đáy ba đã được hình thành trên biểu đồ của công cụ giao dịch EURNZD M5. Mô hình này báo hiệu một sự thay đổi trong xu hướng
Khung thời gian M5 và M15 có thể có nhiều điểm vào lệnh sai hơn.
Open chart in a new window
Đỉnh đôi
was formed on 09.05 at 22:30:52 (UTC+0)
signal strength 1 of 5

Mô hình đảo chiều Đỉnh đôi đã được hình thành trên #Bitcoin M5. Đặc điểm: ranh giới trên 103337.20; ranh giới dưới 102845.36; chiều rộng của mô hình là 51954
Khung thời gian M5 và M15 có thể có nhiều điểm vào lệnh sai hơn.
Open chart in a new window


