Triple Top
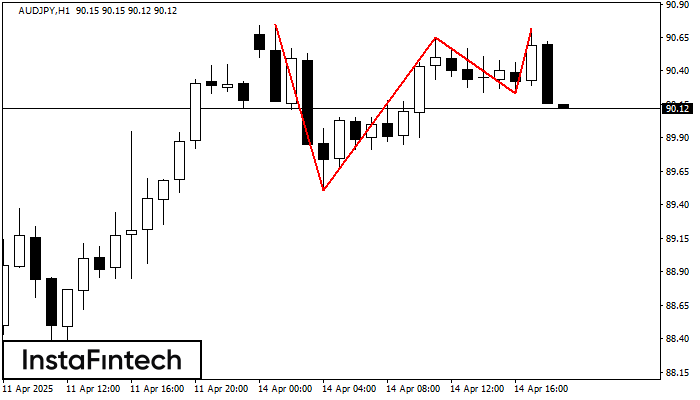
was formed on 14.04 at 18:00:11 (UTC+0)
signal strength 4 of 5

On the chart of the AUDJPY H1 trading instrument, the Triple Top pattern that signals a trend change has formed. It is possible that after formation of the third peak, the price will try to break through the resistance level 89.51, where we advise to open a trading position for sale. Take profit is the projection of the pattern’s width, which is 124 points.
See Also
- All
- All
- Bearish Rectangle
- Bearish Symmetrical Triangle
- Bearish Symmetrical Triangle
- Bullish Rectangle
- Double Top
- Double Top
- Triple Bottom
- Triple Bottom
- Triple Top
- Triple Top
- All
- All
- Buy
- Sale
- All
- 1
- 2
- 3
- 4
- 5
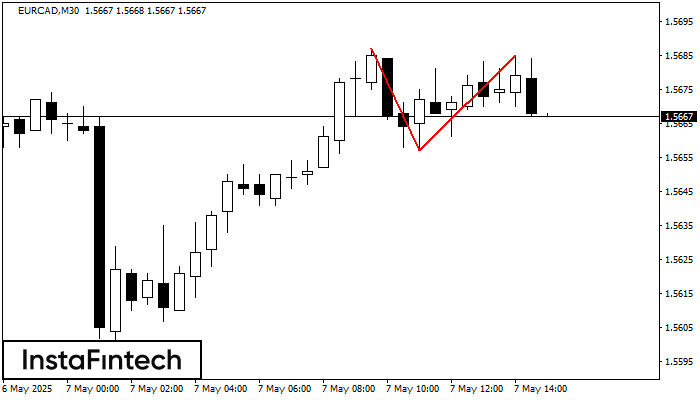
ডাবল টপ
was formed on 07.05 at 14:00:35 (UTC+0)
signal strength 3 of 5
M30 চার্টে, EURCAD-এর ডাবল টপ রিভার্সাল বা বিপরীতমুখী প্যাটার্ন গঠিত হয়েছে। বৈশিষ্ট্য: উপরের সীমানা 1.5687; নীচের সীমানা 1.5657; প্যাটার্নের প্রস্থ হল 28 পয়েন্ট। 1.5657 1.5627 স্তরের দিকে সম্ভাব্য মুভমেন্টের সাথে
Open chart in a new window
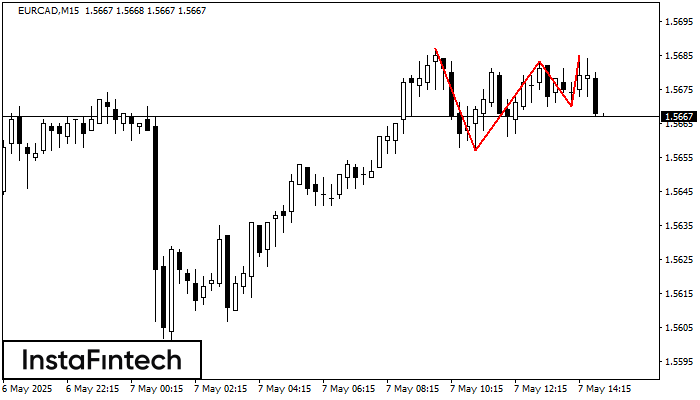
ট্রিপল টপ
was formed on 07.05 at 14:00:25 (UTC+0)
signal strength 2 of 5
M15 চার্টে, EURCAD ট্রেডিং ইন্সট্রুমেন্টের ট্রিপল টপ প্যাটার্ন প্রবণতা পরিবর্তনের ইঙ্গিত দেয়। তৃতীয় পিকের গঠনের পরে, মূল্য 1.5657-এর রেজিস্ট্যান্স স্তর ভেদ করার প্রচেষ্টা চালানোর সম্ভাবনা রয়েছে, এক্ষেত্রে আমরা সেল করার
M5 এবং M15 টাইম ফ্রেমে আরও ভুল এন্ট্রি পয়েন্ট থাকতে পারে।
Open chart in a new window
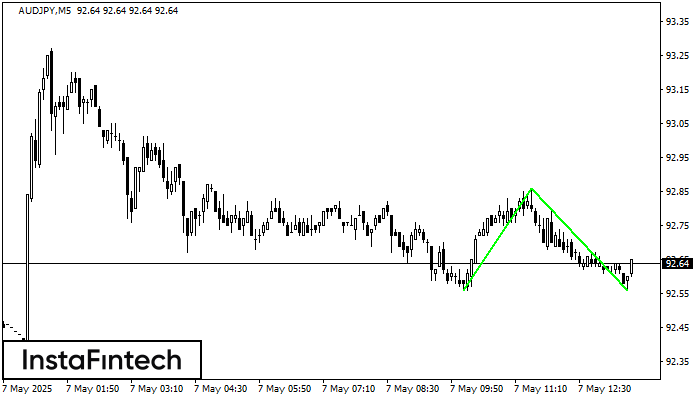
ডাবল বটম
was formed on 07.05 at 12:39:47 (UTC+0)
signal strength 1 of 5
M5 চার্টে, AUDJPY-এর ডাবল বটম প্যাটার্নটি গঠিত হয়েছে। উপরের সীমানা হল 92.86; নীচের সীমানা হল 92.56। প্যাটার্নের প্রস্থ হল 30 পয়েন্ট। 92.86-এর উপরের সীমানা ভেদ করার ক্ষেত্রে, প্রবণতা পরিবর্তনের পূর্বাভাস
M5 এবং M15 টাইম ফ্রেমে আরও ভুল এন্ট্রি পয়েন্ট থাকতে পারে।
Open chart in a new window


