

Actual patterns

Patterns are graphical models which are formed in the chart by the price. According to one of the technical analysis postulates, history (price movement) repeats itself. It means that the price movements are often similar in the same situations which makes it possible to predict the further development of the situation with a high probability.
Relevant patterns by InstaTrade is an easy-to-use service which allows you to be aware of latest changes in the market and react to clues from the market in time. In our service you will always find the latest and most relevant patterns on any pair and any timeframe.
Bullish Symmetrical Triangle
was formed on 14.04 at 04:00:58 (UTC+0)
signal strength 4 of 5

According to the chart of H1, EURNZD formed the Bullish Symmetrical Triangle pattern. Description: This is the pattern of a trend continuation. 2.0005 and 1.9118 are the coordinates of the upper and lower borders respectively. The pattern width is measured on the chart at 887 pips. Outlook: If the upper border 2.0005 is broken, the price is likely to continue its move by 1.9525.
- All
- All
- Bearish Rectangle
- Bearish Symmetrical Triangle
- Bearish Symmetrical Triangle
- Bullish Rectangle
- Double Top
- Double Top
- Triple Bottom
- Triple Bottom
- Triple Top
- Triple Top
- All
- All
- Buy
- Sale
- All
- 1
- 2
- 3
- 4
- 5
Bearish Symmetrical Triangle
was formed on 09.05 at 05:31:45 (UTC+0)
signal strength 1 of 5
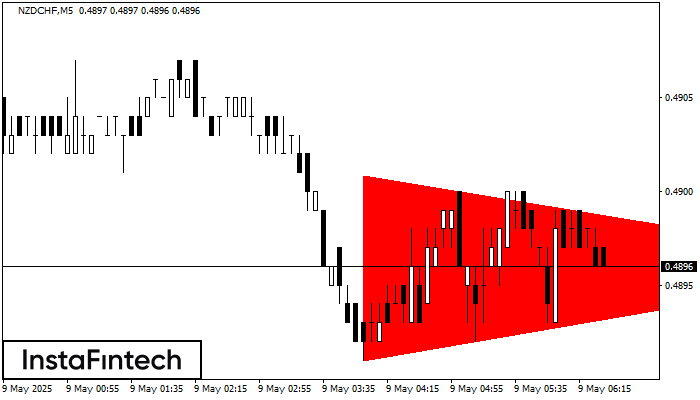
According to the chart of M5, NZDCHF formed the Bearish Symmetrical Triangle pattern. Description: The lower border is 0.4891/0.4896 and upper border is 0.4901/0.4896. The pattern width is measured
The M5 and M15 time frames may have more false entry points.
Open chart in a new window
Head and Shoulders
was formed on 09.05 at 05:05:03 (UTC+0)
signal strength 1 of 5
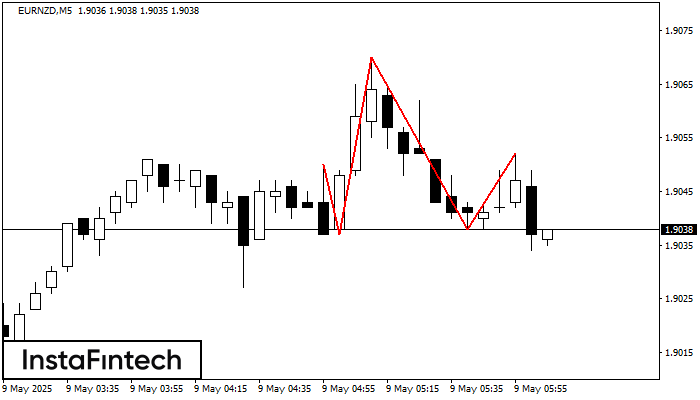
The EURNZD M5 formed the Head and Shoulders pattern with the following features: The Head’s top is at 1.9070, the Neckline and the upward angle are at 1.9037/1.9038. The formation
The M5 and M15 time frames may have more false entry points.
Open chart in a new window
Bearish Rectangle
was formed on 09.05 at 04:05:35 (UTC+0)
signal strength 2 of 5
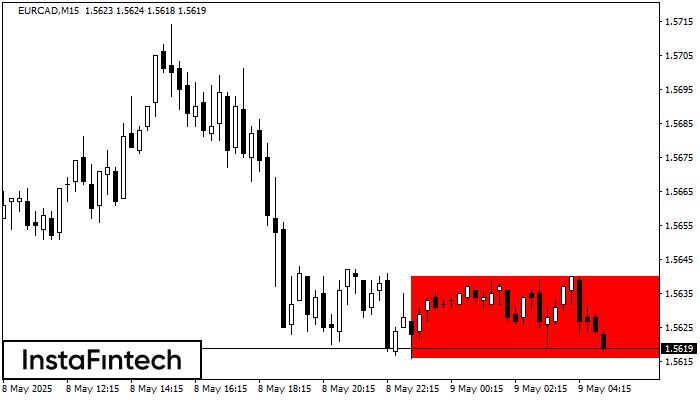
According to the chart of M15, EURCAD formed the Bearish Rectangle. The pattern indicates a trend continuation. The upper border is 1.5640, the lower border is 1.5616. The signal means
The M5 and M15 time frames may have more false entry points.
Open chart in a new window


