

Actual patterns

Patterns are graphical models which are formed in the chart by the price. According to one of the technical analysis postulates, history (price movement) repeats itself. It means that the price movements are often similar in the same situations which makes it possible to predict the further development of the situation with a high probability.
Relevant patterns by InstaTrade is an easy-to-use service which allows you to be aware of latest changes in the market and react to clues from the market in time. In our service you will always find the latest and most relevant patterns on any pair and any timeframe.
Bullish Rectangle
was formed on 08.04 at 08:41:05 (UTC+0)
signal strength 1 of 5
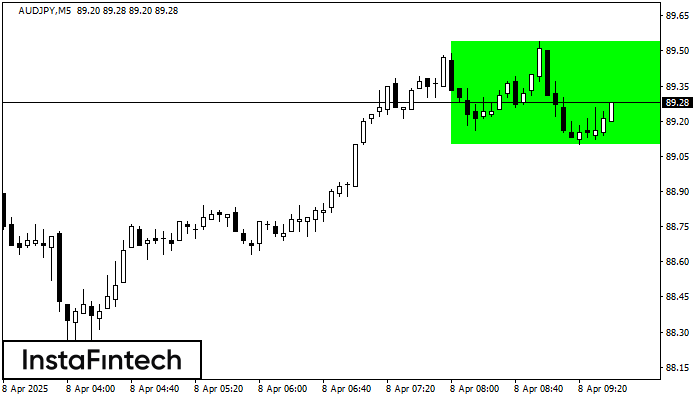
According to the chart of M5, AUDJPY formed the Bullish Rectangle. This type of a pattern indicates a trend continuation. It consists of two levels: resistance 89.54 and support 89.10. In case the resistance level 89.54 - 89.54 is broken, the instrument is likely to follow the bullish trend.
The M5 and M15 time frames may have more false entry points.
- All
- All
- Bearish Rectangle
- Bearish Symmetrical Triangle
- Bearish Symmetrical Triangle
- Bullish Rectangle
- Double Top
- Double Top
- Triple Bottom
- Triple Bottom
- Triple Top
- Triple Top
- All
- All
- Buy
- Sale
- All
- 1
- 2
- 3
- 4
- 5
รูปแบบกราฟจุดสองยอดขาลง (Double Bottom)
was formed on 03.05 at 10:45:44 (UTC+0)
signal strength 2 of 5

รูปแบบ รูปแบบกราฟจุดสองยอดขาลง (Double Bottom) ถูกสร้างขึ้นมาใน #Bitcoin M15 การก่อตัวเช่นนี้แสดงถึงการย้อนตัวของแนวโน้มจากด้านล่าง ขึ้นมายังด้านบน สัญญาณแสดงให้เห็นถึง การเทรดแบบการซื้อที่ควรเปิด หลังจากที่มีการเคลื่อนตัวทะลุผ่านขอบเขตด้านบนของรูปแบบ 96350.17 การเคลื่อนไหวต่อจากนั้นจะอยู่ในความกว้างของรูปแบบปัจจุบัน 26191
ขอบเตระยะเวลาใน M5 และ M15 อาจจะมีตำแหน่งการเข้าใช้งานที่ผิดพลาดมากยิ่งขึ้น
Open chart in a new window
รูปแบบกราฟจุดสองยอดขาลง (Double Bottom)
was formed on 03.05 at 08:00:01 (UTC+0)
signal strength 3 of 5

รูปแบบ รูปแบบกราฟจุดสองยอดขาลง (Double Bottom) ถูกสร้างขึ้นมาใน #Bitcoin M30; ขอบเขตด้านบนอยู่ที่ 97860.25;ขอบเขตด้านล่าง คือ 96258.44 ความกว้างของรูปแบบนี้คือ 156618 จุด กรณีที่มีการเคลื่อนตัวทะลุผ่านขอบเขตด้านบน
Open chart in a new window
รูปแบบกราฟจุดสองยอดขาลง (Double Bottom)
was formed on 03.05 at 06:20:09 (UTC+0)
signal strength 1 of 5

รูปแบบ รูปแบบกราฟจุดสองยอดขาลง (Double Bottom) ถูกสร้างขึ้นมาใน #Bitcoin M5; ขอบเขตด้านบนอยู่ที่ 96467.62;ขอบเขตด้านล่าง คือ 96258.44 ความกว้างของรูปแบบนี้คือ 20692 จุด กรณีที่มีการเคลื่อนตัวทะลุผ่านขอบเขตด้านบน
ขอบเตระยะเวลาใน M5 และ M15 อาจจะมีตำแหน่งการเข้าใช้งานที่ผิดพลาดมากยิ่งขึ้น
Open chart in a new window


