

Actual patterns

Patterns are graphical models which are formed in the chart by the price. According to one of the technical analysis postulates, history (price movement) repeats itself. It means that the price movements are often similar in the same situations which makes it possible to predict the further development of the situation with a high probability.
Relevant patterns by InstaTrade is an easy-to-use service which allows you to be aware of latest changes in the market and react to clues from the market in time. In our service you will always find the latest and most relevant patterns on any pair and any timeframe.
Triple Top
was formed on 02.04 at 06:50:26 (UTC+0)
signal strength 1 of 5
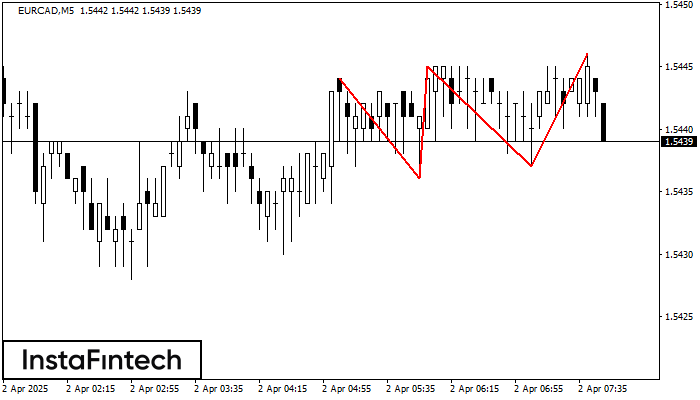
The Triple Top pattern has formed on the chart of the EURCAD M5. Features of the pattern: borders have an ascending angle; the lower line of the pattern has the coordinates 1.5436/1.5437 with the upper limit 1.5444/1.5446; the projection of the width is 8 points. The formation of the Triple Top figure most likely indicates a change in the trend from upward to downward. This means that in the event of a breakdown of the support level of 1.5436, the price is most likely to continue the downward movement.
The M5 and M15 time frames may have more false entry points.
- All
- All
- Bearish Rectangle
- Bearish Symmetrical Triangle
- Bearish Symmetrical Triangle
- Bullish Rectangle
- Double Top
- Double Top
- Triple Bottom
- Triple Bottom
- Triple Top
- Triple Top
- All
- All
- Buy
- Sale
- All
- 1
- 2
- 3
- 4
- 5
Double Bottom
was formed on 21.04 at 10:30:12 (UTC+0)
signal strength 2 of 5

Corak Double Bottom telah dibentuk pada USDCAD M15; sempadan atas adalah 1.3801; sempadan bawah adalah 1.3791. Lebar corak adalah 11 mata. Sekiranya penembusan sempadan atas 1.3801, perubahan aliran boleh diramalkan
Carta masa M5 dan M15 mungkin mempunyai lebih banyak titik kemasukan palsu.
Open chart in a new window
Pennant Aliran Menaik
was formed on 21.04 at 10:10:25 (UTC+0)
signal strength 1 of 5

Isyarat Pennant Aliran Menaik – Instrumen dagangan NZDCAD M5, corak kesinambungan. Ramalan: adalah mungkin untuk menetapkan kedudukan membeli di atas paras tinggi corak 0.8304, dengan prospek pergerakan seterusnya menjadi unjuran
Carta masa M5 dan M15 mungkin mempunyai lebih banyak titik kemasukan palsu.
Open chart in a new window
Pennant Aliran Menaik
was formed on 21.04 at 10:06:26 (UTC+0)
signal strength 1 of 5

Corak grafik Pennant Aliran Menaik telah terbentuk pada instrumen NZDUSD M5. Jenis corak ini berada di bawah kategori corak kesinambungan. Dalam situasi ini, sekiranya penetapan harga boleh menembusi tinggi, adalah
Carta masa M5 dan M15 mungkin mempunyai lebih banyak titik kemasukan palsu.
Open chart in a new window


