

Actual patterns

Patterns are graphical models which are formed in the chart by the price. According to one of the technical analysis postulates, history (price movement) repeats itself. It means that the price movements are often similar in the same situations which makes it possible to predict the further development of the situation with a high probability.
Relevant patterns by InstaTrade is an easy-to-use service which allows you to be aware of latest changes in the market and react to clues from the market in time. In our service you will always find the latest and most relevant patterns on any pair and any timeframe.
Bullish Rectangle
was formed on 01.04 at 15:36:34 (UTC+0)
signal strength 1 of 5
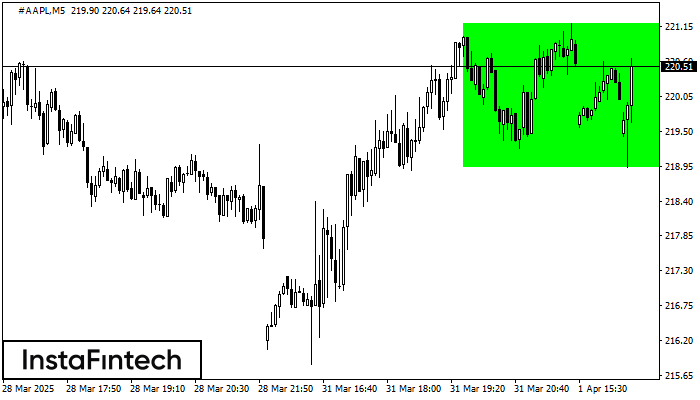
According to the chart of M5, #AAPL formed the Bullish Rectangle. This type of a pattern indicates a trend continuation. It consists of two levels: resistance 221.19 and support 218.93. In case the resistance level 221.19 - 221.19 is broken, the instrument is likely to follow the bullish trend.
The M5 and M15 time frames may have more false entry points.
- All
- All
- Bearish Rectangle
- Bearish Symmetrical Triangle
- Bearish Symmetrical Triangle
- Bullish Rectangle
- Double Top
- Double Top
- Triple Bottom
- Triple Bottom
- Triple Top
- Triple Top
- All
- All
- Buy
- Sale
- All
- 1
- 2
- 3
- 4
- 5
Teratas Ganda
was formed on 09.05 at 03:59:58 (UTC+0)
signal strength 1 of 5
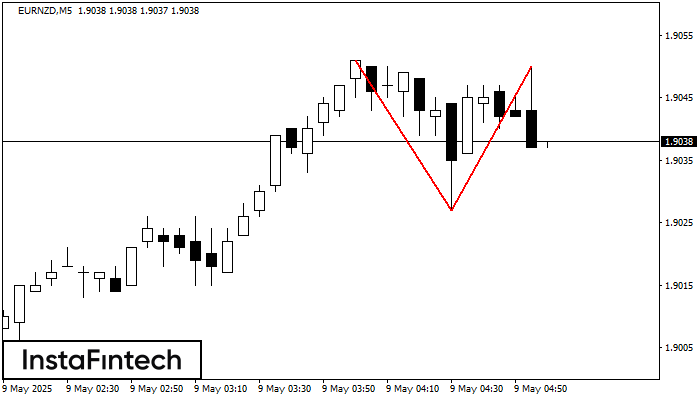
Pola reversal Teratas Ganda telah terbentuk pada EURNZD M5. Karakteristik: batas atas 1.9051; batas bawah 1.9027; lebar pola 23 poin. Transaksi jual lebih baik dibuka di bawah batas bawah 1.9027
Rangka waktu M5 dan M15 mungkin memiliki lebih dari titik entri yang keliru.
Open chart in a new window
Bawah Triple
was formed on 09.05 at 03:15:01 (UTC+0)
signal strength 2 of 5
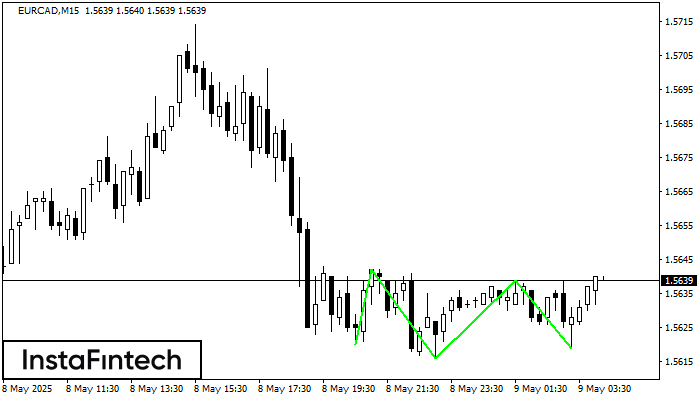
Pola Bawah Triple telah terbentuk pada grafik EURCAD M15. Fitur-fitur pola: garis bawah pola memiliki koordinat 1.5642 dengan batas atas 1.5642/1.5639, proyeksi lebar adalah 22 poin. Pembentukan pola Bawah Triple
Rangka waktu M5 dan M15 mungkin memiliki lebih dari titik entri yang keliru.
Open chart in a new window
Teratas Ganda
was formed on 09.05 at 03:00:15 (UTC+0)
signal strength 3 of 5
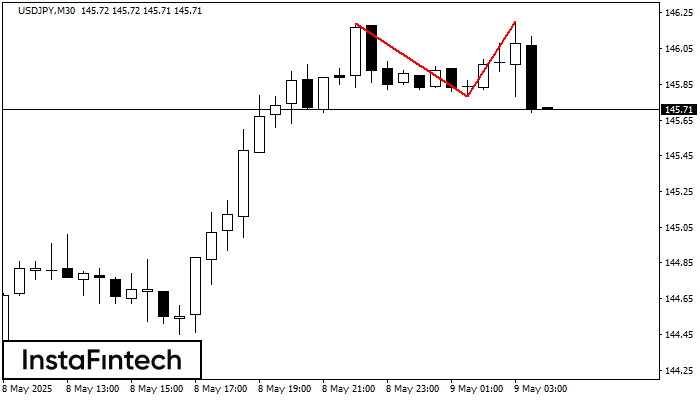
Pola Teratas Ganda telah terbentuk pada USDJPY M30. Pola ini menandakan bahwa tren telah berubah dari kenaikan menjadi penurunan. Mungkin, jika dasar pola di 145.78 ditembus, maka pergerakan menurun akan
Open chart in a new window

