

Actual patterns

Patterns are graphical models which are formed in the chart by the price. According to one of the technical analysis postulates, history (price movement) repeats itself. It means that the price movements are often similar in the same situations which makes it possible to predict the further development of the situation with a high probability.
Relevant patterns by InstaTrade is an easy-to-use service which allows you to be aware of latest changes in the market and react to clues from the market in time. In our service you will always find the latest and most relevant patterns on any pair and any timeframe.
Bearish pennant
was formed on 31.03 at 16:30:30 (UTC+0)
signal strength 2 of 5
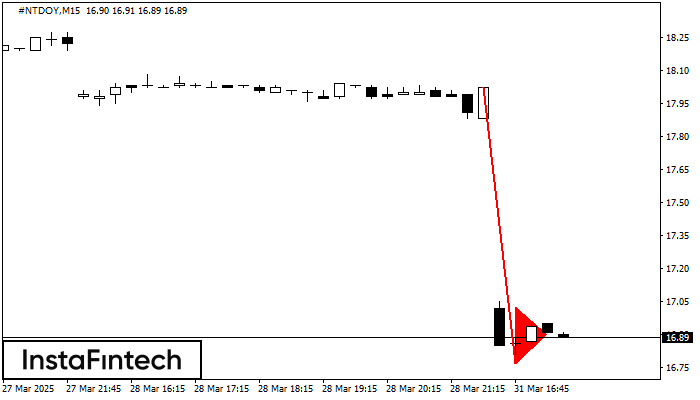
The Bearish pennant pattern has formed on the #NTDOY M15 chart. This pattern type is characterized by a slight slowdown after which the price will move in the direction of the original trend. In case the price fixes below the pattern’s low of 16.77, a trader will be able to successfully enter the sell position.
The M5 and M15 time frames may have more false entry points.
See Also
- All
- All
- Bearish Rectangle
- Bearish Symmetrical Triangle
- Bearish Symmetrical Triangle
- Bullish Rectangle
- Double Top
- Double Top
- Triple Bottom
- Triple Bottom
- Triple Top
- Triple Top
- All
- All
- Buy
- Sale
- All
- 1
- 2
- 3
- 4
- 5
Прямоугольник
сформирован 11.05 в 01:12:20 (UTC+0)
сила сигнала 1 из 5

Сформирована фигура «Прямоугольник» на графике #Bitcoin M5. Тип фигуры: Продолжение тренда; Границы: Верхняя 103800.29, Нижняя 103508.08; Сигнал: позицию на покупку следует открывать выше верхней границы прямоугольника 103800.29
Таймфреймы М5 и М15 могут иметь больше ложных точек входа.
Открыть график инструмента в новом окне
Двойная вершина
сформирован 11.05 в 00:45:18 (UTC+0)
сила сигнала 1 из 5

На торговом графике #Bitcoin M5 сформировалась разворотная фигура «Двойная вершина». Характеристика: Верхняя граница 103800.29; Нижняя граница 103508.08; Ширина фигуры 29221 пунктов. Сигнал: Пробой нижней границы 103508.08 приведет к дальнейшему нисходящему
Таймфреймы М5 и М15 могут иметь больше ложных точек входа.
Открыть график инструмента в новом окне
Прямоугольник
сформирован 09.05 в 22:57:29 (UTC+0)
сила сигнала 1 из 5

Сформирована фигура «Прямоугольник» на графике GBPJPY M5. Тип фигуры: Продолжение тренда; Границы: Верхняя 193.44, Нижняя 193.24; Сигнал: позицию на покупку следует открывать выше верхней границы прямоугольника 193.44
Таймфреймы М5 и М15 могут иметь больше ложных точек входа.
Открыть график инструмента в новом окне


