

Actual patterns

Patterns are graphical models which are formed in the chart by the price. According to one of the technical analysis postulates, history (price movement) repeats itself. It means that the price movements are often similar in the same situations which makes it possible to predict the further development of the situation with a high probability.
Relevant patterns by InstaTrade is an easy-to-use service which allows you to be aware of latest changes in the market and react to clues from the market in time. In our service you will always find the latest and most relevant patterns on any pair and any timeframe.
Double Bottom
was formed on 10.04 at 13:40:08 (UTC+0)
signal strength 1 of 5
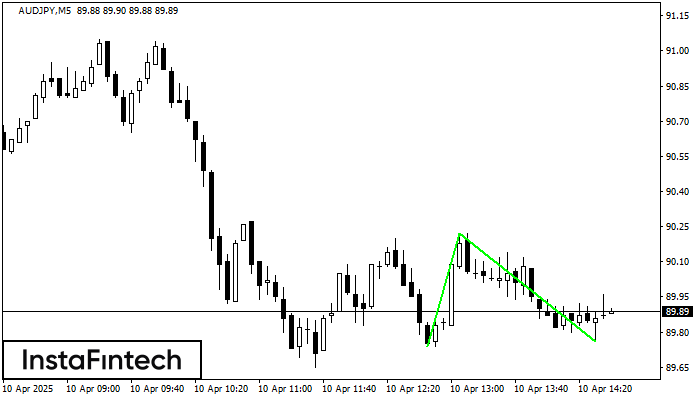
The Double Bottom pattern has been formed on AUDJPY M5; the upper boundary is 90.22; the lower boundary is 89.76. The width of the pattern is 48 points. In case of a break of the upper boundary 90.22, a change in the trend can be predicted where the width of the pattern will coincide with the distance to a possible take profit level.
The M5 and M15 time frames may have more false entry points.
See Also
- All
- All
- Bearish Rectangle
- Bearish Symmetrical Triangle
- Bearish Symmetrical Triangle
- Bullish Rectangle
- Double Top
- Double Top
- Triple Bottom
- Triple Bottom
- Triple Top
- Triple Top
- All
- All
- Buy
- Sale
- All
- 1
- 2
- 3
- 4
- 5
Bullish Symmetrical Triangle
сформирован 06.05 в 20:48:32 (UTC+0)
сила сигнала 2 из 5
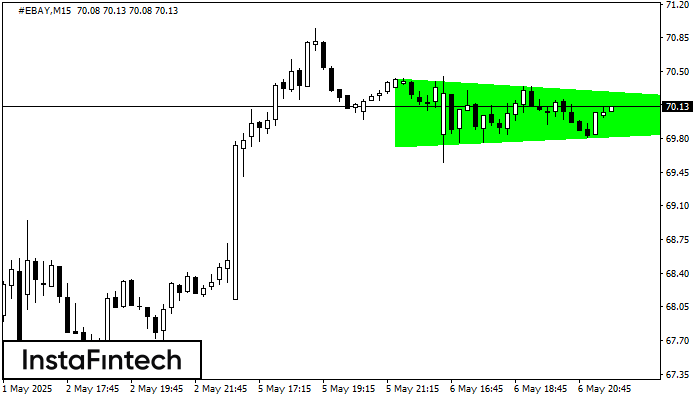
According to the chart of M15, #EBAY formed the Bullish Symmetrical Triangle pattern. The lower border of the pattern touches the coordinates 69.72/70.02 whereas the upper border goes across 70.42/70.02
The M5 and M15 time frames may have more false entry points.
Открыть график инструмента в новом окне
Bearish Flag
сформирован 06.05 в 20:35:36 (UTC+0)
сила сигнала 2 из 5
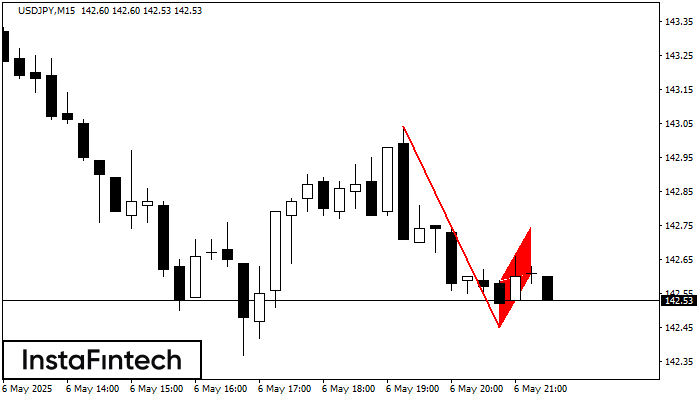
The Bearish Flag pattern has been formed on USDJPY at M15. The lower boundary of the pattern is located at 142.45/142.61 while the upper boundary lies at 142.59/142.75. The projection
The M5 and M15 time frames may have more false entry points.
Открыть график инструмента в новом окне
Bearish pennant
сформирован 06.05 в 20:35:32 (UTC+0)
сила сигнала 2 из 5
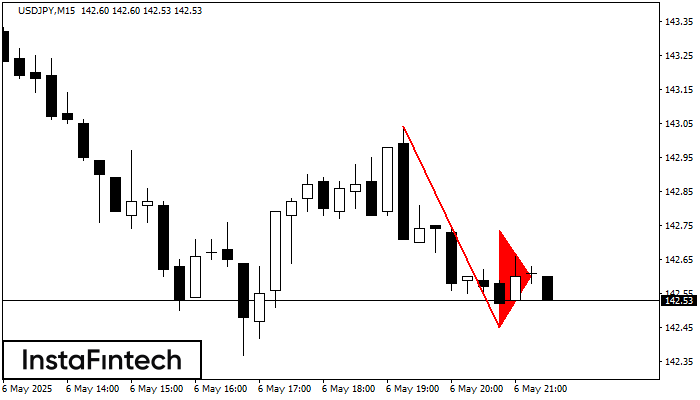
The Bearish pennant pattern has formed on the USDJPY M15 chart. The pattern signals continuation of the downtrend in case the pennant’s low of 142.45 is broken through. Recommendations: Place
The M5 and M15 time frames may have more false entry points.
Открыть график инструмента в новом окне


