

Actual patterns

Patterns are graphical models which are formed in the chart by the price. According to one of the technical analysis postulates, history (price movement) repeats itself. It means that the price movements are often similar in the same situations which makes it possible to predict the further development of the situation with a high probability.
Relevant patterns by InstaTrade is an easy-to-use service which allows you to be aware of latest changes in the market and react to clues from the market in time. In our service you will always find the latest and most relevant patterns on any pair and any timeframe.
Double Bottom
was formed on 25.03 at 02:55:11 (UTC+0)
signal strength 1 of 5
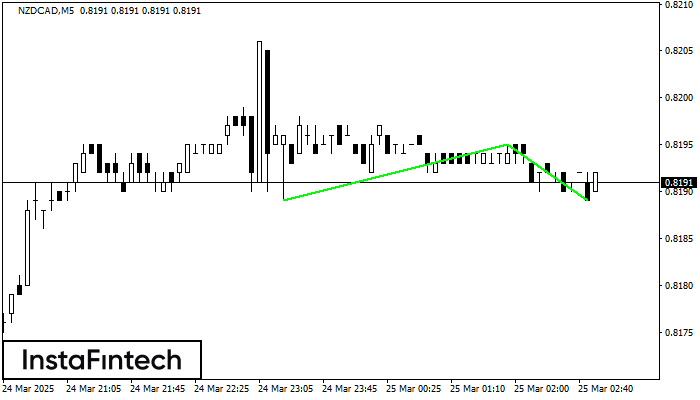
The Double Bottom pattern has been formed on NZDCAD M5; the upper boundary is 0.8195; the lower boundary is 0.8189. The width of the pattern is 6 points. In case of a break of the upper boundary 0.8195, a change in the trend can be predicted where the width of the pattern will coincide with the distance to a possible take profit level.
The M5 and M15 time frames may have more false entry points.
- All
- All
- Bearish Rectangle
- Bearish Symmetrical Triangle
- Bearish Symmetrical Triangle
- Bullish Rectangle
- Double Top
- Double Top
- Triple Bottom
- Triple Bottom
- Triple Top
- Triple Top
- All
- All
- Buy
- Sale
- All
- 1
- 2
- 3
- 4
- 5
Прямоугольник
сформирован 08.05 в 19:25:47 (UTC+0)
сила сигнала 1 из 5
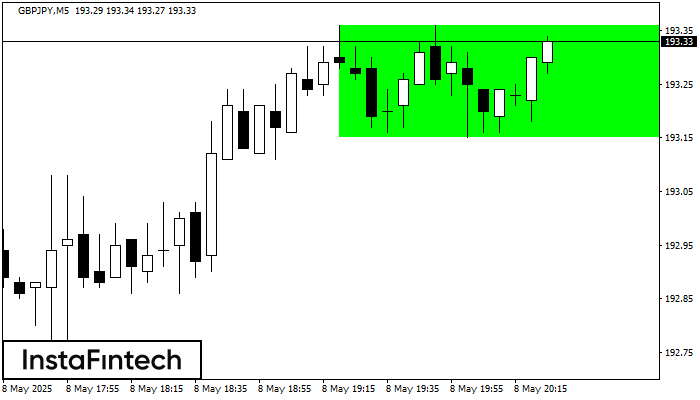
Сформирована фигура «Прямоугольник» на графике GBPJPY M5. Тип фигуры: Продолжение тренда; Границы: Верхняя 193.36, Нижняя 193.15; Сигнал: позицию на покупку следует открывать выше верхней границы прямоугольника 193.36
Таймфреймы М5 и М15 могут иметь больше ложных точек входа.
Открыть график инструмента в новом окне
Двойное дно
сформирован 08.05 в 19:20:20 (UTC+0)
сила сигнала 1 из 5
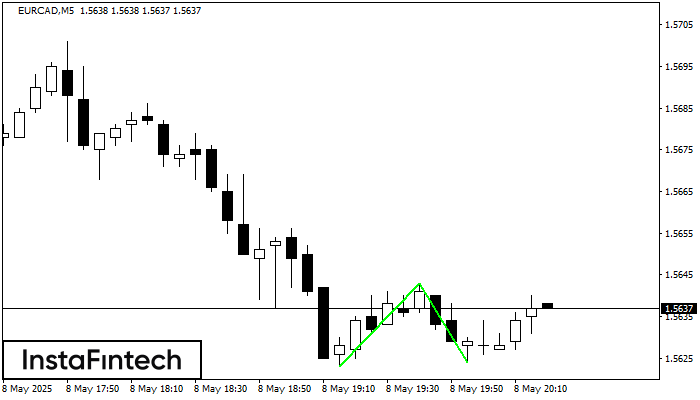
Сформирована фигура «Двойное дно» на графике EURCAD M5. Верхняя граница 1.5643; Нижняя граница 1.5624; Ширина фигуры 20 пунктов. В случае пробоя верхней границы 1.5643 можно будет прогнозировать изменение тенденции
Таймфреймы М5 и М15 могут иметь больше ложных точек входа.
Открыть график инструмента в новом окне
Бычий симметричный треугольник
сформирован 08.05 в 19:15:36 (UTC+0)
сила сигнала 1 из 5
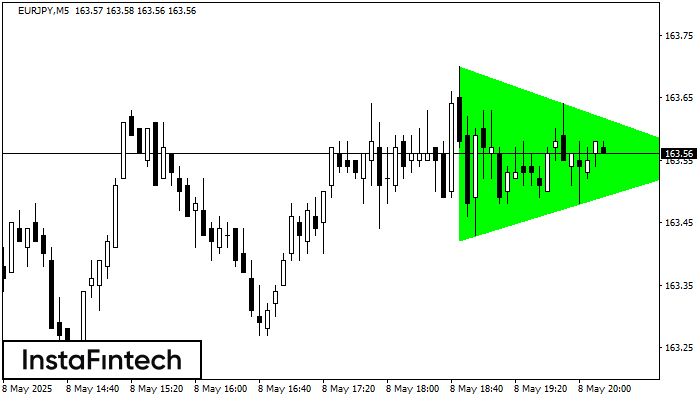
По EURJPY на M5 сформировалась фигура «Бычий симметричный треугольник». Нижняя граница фигуры имеет координаты 163.42/163.55, при этом верхняя граница 163.70/163.55. Формирование фигуры «Бычий симметричный треугольник» наиболее вероятным образом свидетельствует
Таймфреймы М5 и М15 могут иметь больше ложных точек входа.
Открыть график инструмента в новом окне


