Voir aussi


 22.02.2023 01:03 AM
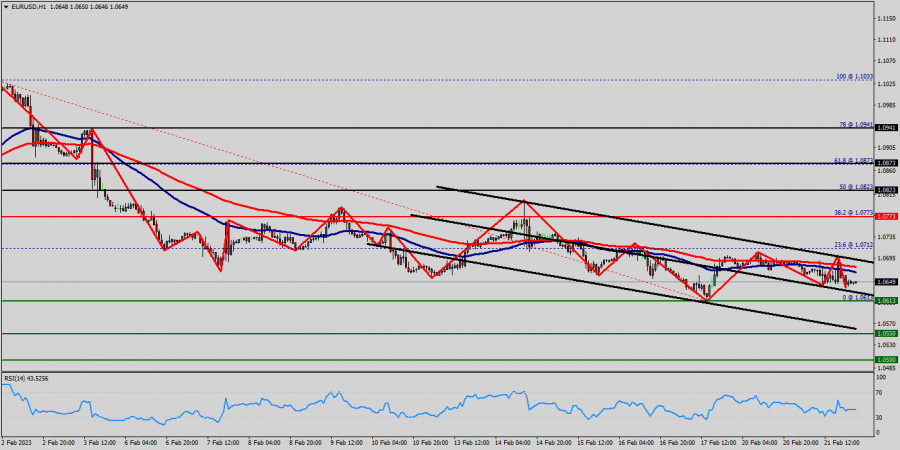
The EUR/USD pair continues to move downwards from the level of 1.0733. Yesterday, the pair dropped from the level of 1.0733 (this level of 1.0733 coincides with the double top - 38.2% of Fibonacci retracement levels) to the bottom around 1.0649. Today, the first resistance level is seen at 1.0712 followed by 1.0733 (the daily pivot point), while daily support 1 is found at 1.0613.
Also, the level of 1.0733 represents a weekly pivot point for that it is acting as major resistance/support this week. Amid the previous events, the pair is still in a downtrend, because the EUR/USD pair is trading in a bearish trend from the new resistance line of 1.0785 towards the first support level at 1.0670 in order to test it. If the pair succeeds to pass through the level of 1.0670, the market will indicate a bearish opportunity below the level of 1.0670.
So, we expect the price to set below the strong (first) support at the level of 1.0670; because the price is in a bearish channel now. The RSI starts signaling a downward trend. Consequently, the market is likely to show signs of a bearish trend. If the trend breaks the major support at 1.0670, the pair will move downwards continuing the bearish trend development to the level 1.0623 in order to test the daily support 2.
The EUR/USD pair is showing signs of strength following a breakout of the lowest level of 1.0550. The market is indicating a bearish opportunity above the above-mentioned support levels, for that the bearish outlook remains the same as long as the 100 EMA is headed to the downside. However, if a breakout happens at the resistance level of 1.0733, then this scenario may be invalidated.
You have already liked this post today
*The market analysis posted here is meant to increase your awareness, but not to give instructions to make a trade.
Sur le graphique horaire, la paire GBP/USD s'est consolidée mercredi au-dessus du faible niveau de retracement de 161,8% à 1,3520. Cette consolidation permet d'espérer une poursuite de la croissance vers
Avec la condition de l'indicateur Stochastic Oscillator au niveau de surachat et une divergence qui apparaît entre l'indicateur et le mouvement des prix de l'indice Nasdaq
L'indicateur eagle montre un signal négatif pour l'euro, suggérant une possible baisse dans les jours à venir. Par conséquent, notre perspective reste baissière tant que le prix se consolide
D'un autre côté, si la force haussière prévaut, nous pourrions nous attendre à un rebond technique autour de 3 355. Cette zone a déjà offert un bon point de rebond
Indicateur de
patterns graphiques.
fera voir ce que
vous ne remarquez pas!
Comptes PAMM
InstaForex

Your IP address shows that you are currently located in the USA. If you are a resident of the United States, you are prohibited from using the services of InstaFintech Group including online trading, online transfers, deposit/withdrawal of funds, etc.
If you think you are seeing this message by mistake and your location is not the US, kindly proceed to the website. Otherwise, you must leave the website in order to comply with government restrictions.
Why does your IP address show your location as the USA?
Please confirm whether you are a US resident or not by clicking the relevant button below. If you choose the wrong option, being a US resident, you will not be able to open an account with InstaTrade anyway.
We are sorry for any inconvenience caused by this message.

