Voir aussi


 30.09.2022 07:20 PM
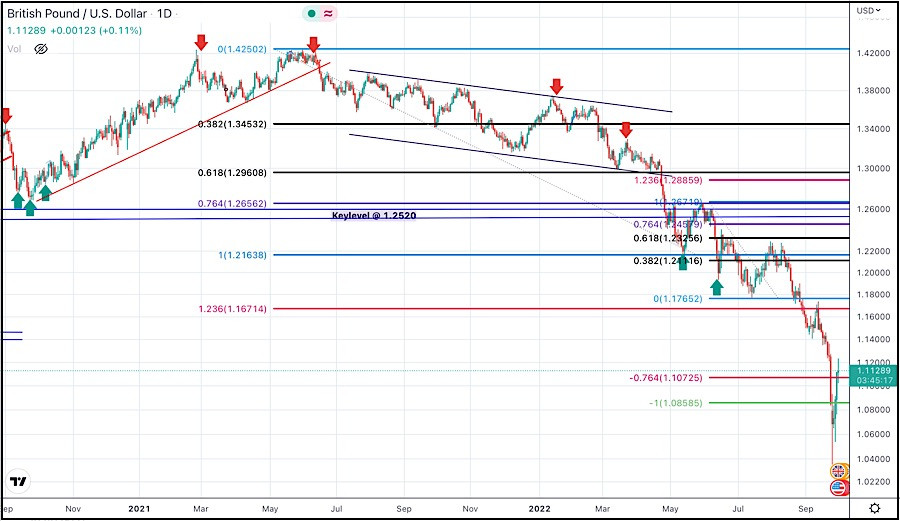
Previously, the GBP/USD pair remained under bearish pressure to challenge the lower limit of the channel around 1.3000 which failed to hold prices above.
Shortly after, a new daily low was established around 1.2150 which was bypassed few days after.
However, considerable support zone existed around 1.1850-1.1900 which has prevented further bearish decline for sometime.
However, as bullish momentum started to fade away, more bearish visits were expected to challenge these historical low levels.
Shortly after, Quick bearish decline was executed towards 1.1075 & 1.0860 where significant Fibonacci Expansion levels are located.
Based on the upcoming price action and the current weekly candlestick closure, the next target level for the GBP/USD pair can be determined.
Further bearish decline towards 0.9950 may be expected shortly unless the current re-closure above 1.0860 is maintained for some time. If so, the current scenari would be a high probability bullish pullback at least towards 1.1400.
You have already liked this post today
*The market analysis posted here is meant to increase your awareness, but not to give instructions to make a trade.
Notre plan de trading pour les prochaines heures est d'acheter au-dessus de 3 270 ou au-dessus de 3 281, avec des objectifs à court terme autour de 8/8 de Murray
Liens utiles : Mes autres articles sont disponibles dans cette section Cours InstaForex pour débutants Analytics Populaires Ouvrir un compte de trading Important : Les débutants en trading forex doivent
Tôt dans la session américaine, la paire EUR/USD se négocie autour de 1,1358 au sein du canal baissier formé le 18 avril. La paire est sous pression baissière. Nous pensons
Liens utiles : Mes autres articles sont disponibles dans cette section Cours InstaForex pour débutants Analytique Populaire Ouvrir un compte de trading Important : Les débutants dans le trading forex
Sur le graphique de 4 heures, l'instrument de la matière première argent est visible même si sa condition se renforce, ce qui est confirmé par le mouvement du prix
Bien que sur le graphique de 4 heures, l'indice Nasdaq 100 soit en phase latérale, la fourchette est assez large pour offrir une opportunité assez prometteuse. Actuellement, l'indicateur Stochastic Oscillator
Notifications
SMS/E-mail

Your IP address shows that you are currently located in the USA. If you are a resident of the United States, you are prohibited from using the services of InstaFintech Group including online trading, online transfers, deposit/withdrawal of funds, etc.
If you think you are seeing this message by mistake and your location is not the US, kindly proceed to the website. Otherwise, you must leave the website in order to comply with government restrictions.
Why does your IP address show your location as the USA?
Please confirm whether you are a US resident or not by clicking the relevant button below. If you choose the wrong option, being a US resident, you will not be able to open an account with InstaTrade anyway.
We are sorry for any inconvenience caused by this message.

